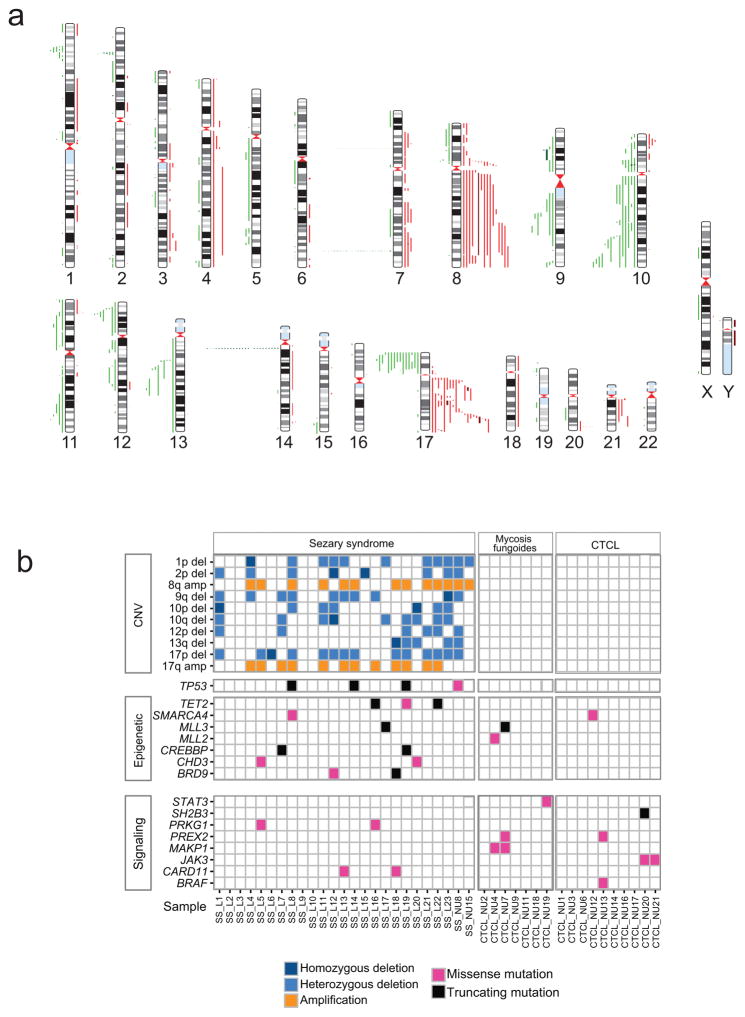
Figure 1.
Somatic copy number variants and mutations in Sézary syndrome and CTCL. (a) Human chromosomal ideograms show the areas of genetic gain and loss identified by whole exome sequencing in Sézary syndrome and CTCL samples. Red bars to the right of the chromosomes represent areas of gain with dark red indicating regions of amplification. Green bars to the left of the chromosomes represent areas of heterozygous loss and dark green bars indicate homozygous deletions. (b) Schematic representation of the distribution of recurrent somatic copy number alterations and mutations in epigenetic factors and signaling genes in Sézary syndrome and CTCL.

