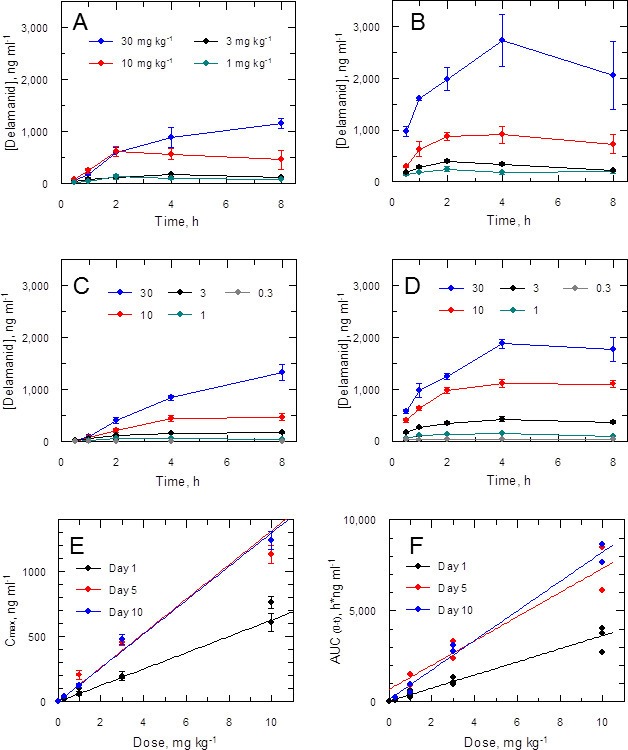
Figure 3. Pharmacokinetic behaviour of delamanid in infected mice.

(A and B) show the blood levels of delamanid following the first oral dose on day 1 (A) and the penultimate oral dose on day 5 (B) for 1, 3, 10 and 30 mg kg-1 b.i.d. (teal, black, red and blue symbols, respectively). Error bars are SEM (n = 3 for 30 mg kg-1, n = 6 all other doses). (C and D) show the blood levels of delamanid from a single VL PK/PD study following the first oral dose on day 1 (C) and the penultimate oral dose on day 10 (D) for 0.3, 1, 3, 10 and 30 mg kg-1 b.i.d. (grey, teal, black, red and blue symbols, respectively). Error bars are SEM (n = 5). (E and F) show the relationship between dose with Cmax or AUC(0-8 h), respectively, after the first oral dose on day 1 (black), or the penultimate dose on day 5 (red) or day 10 (blue). Error bars in (E) are SEM (n ranges from 3–8 depending upon day and dose – see Figure 2 – source data1). Lines in (E) and (F) are best fits by linear regression.
