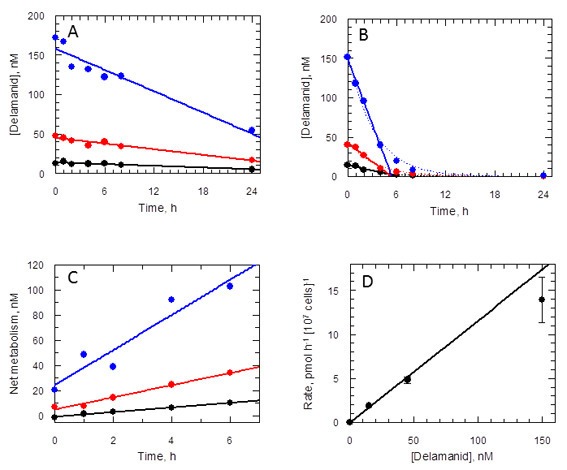
Figure 6. Delamanid metabolism in L. donovani promastigotes.

(A) Medium plus delamanid alone and (B) cells incubated in medium plus delamanid. Delamanid concentrations added are 15, 45 and 150 nM (black, red and blue, respectively). The lines represent best fits by linear regression for all data points in (A) and 0 to 5 hr in (B). The dotted line in (B) is the best fit by non-linear regression to a single exponential decay. (C) Net metabolism of delamanid by cells was obtained by subtraction of (A) from (B). Data fitted by linear regression gave correlation coefficients of 0.996, 0.991 and 0.951 for delamanid concentrations of 15, 45 and 150 nM, respectively. (D) Rates of delamanid metabolism obtained from (C) are linear up to 150 nM (correlation coefficient 0.996, explicit errors used in fit).
