. 2016 May 9;5:e14029. doi: 10.7554/eLife.14029

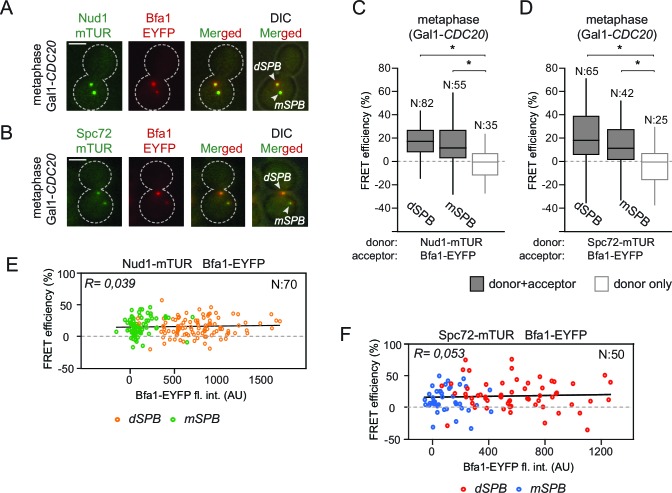
Figure 2. Bfa1 interacts with Spc72 and Nud1 at the daughter and mother SPBs.

(A–B) Representative images of metaphase-arrested cells carrying Nud1-mTUR Bfa1-EYFP (A) and Spc72-mTUR Bfa1-EYFP (B). Scale bar: 3 μm. (C–D) Box and Whiskers plots showing FRET efficiency for the indicated Nud1-Bfa1 (C) and Spc72-Bfa1 (D) pairs at the daughter and mother SPBs (dSPB and mSPB) in metaphase-arrested cells. N: sample size. Asterisks show significant difference according to student’s t-test (p<0.01). See the accompanying data files (Figure 2—source data 1 and 2) for exact p-values. (E–F) Scatter plots of FRET efficiencies for Nud1-Bfa1 (E) and Spc72-Bfa1 (F) pairs as a function of Bfa1-EYFP fluorescence intensity values obtained from the dSPB and from the mSPB. N: Sample size. R: r-squared value for the best-fit trendline.

DOI: http://dx.doi.org/10.7554/eLife.14029.010

Figure 2—source data 1. Raw data and the calculated FRET efficiencies of Nud1-Bfa1 and Spc72-Bfa1 pairs at SPBs in metaphase arrested cells (source data for Figure 2C).
DOI: 10.7554/eLife.14029.011
Figure 2—source data 2. Raw data and the calculated FRET efficiencies of the Spc72-Bfa1 pair at the mother and the daughter SPB in metaphase arrested cells (source data for Figure 2D).
DOI: 10.7554/eLife.14029.012

Figure 2.

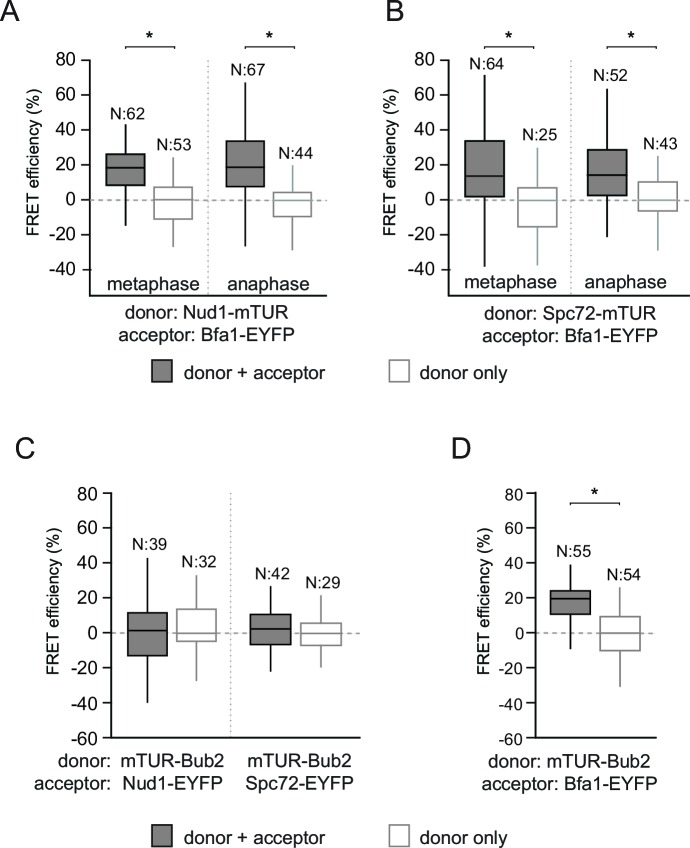
Figure 2—figure supplement 1. FRET analysis of Bfa1 and Bub2.

Figure 2—figure supplement 1.

(A–B) FRET efficiencies of Bfa1-Nud1 (A) and Bfa1-Spc72 (B) in metaphase and anaphase arrested cells. Metaphase arrest is achieved by Cdc20 depletion (Gal1-CDC20) and anaphase arrest was induced by overproduction of nondegradable Clb2 (Gal1-CLB2ΔDB). (C–D) FRET efficiency of mTUR-Bub2 with Nud1-EYFP and Spc72-EYP (C) or with Bfa1 C-terminal fusion (D). Box-whisker plots in C and D are one out of two technical replicates from the same experiment. N: sample size. Asterisks show significant difference according to student’s t-test (p<0.01). See the accompanying data file for exact p-values (Figure 2—figure supplement 1—source data 14).
Figure 2—figure supplement 1—source data 1. Raw and calculated FRET efficiencies of the Bfa1-Nud1 pair in metaphase and anaphase arrested cells (source data for Figure 2—figure supplement 1A).
DOI: 10.7554/eLife.14029.014
Figure 2—figure supplement 1—source data 2. Raw and calculated FRET efficiencies of the Bfa1-Spc72 pair in metaphase and anaphase arrested cells (source data for Figure 2—figure supplement 1B).
DOI: 10.7554/eLife.14029.015
Figure 2—figure supplement 1—source data 3. Raw and calculated FRET efficiencies of Bub2-Nud1 and Bub2-Spc72 pairs in cycling cells (source data for Figure 2—figure supplement 1C).
DOI: 10.7554/eLife.14029.016
Figure 2—figure supplement 1—source data 4. Raw and calculated FRET efficiencies of Bub2-Bfa1 pair in cycling cells (source data for Figure 2—figure supplement 1D).
DOI: 10.7554/eLife.14029.017