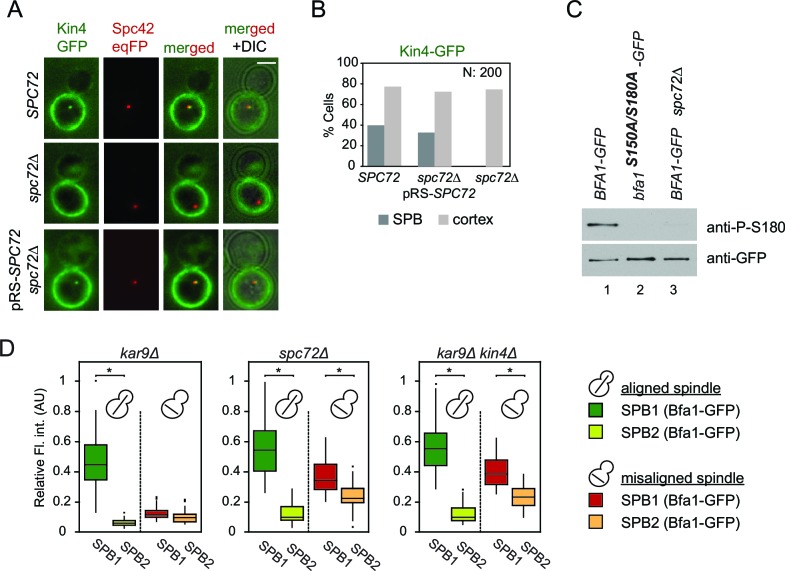
Figure 5. Lack of Spc72 interferes with Kin4 localization and functioning at the SPB.
(A) SPB localization of Kin4-GFP in SPC72 (pRS-SPC72 spc72∆) and spc72∆ cells carrying the SPB marker SPC42-eqFP. Cells were arrested in metaphase with nocodazole. (B) Quantification of (A). (C) Immunoblots showing Bfa1 phosphorylation by Kin4 at S180 residue. Bfa1-GFP was immunoprecipitated from indicated strains. Total amount of immunoprecipitated Bfa1-GFP and Bfa1-GFP that is phosphorylated at S180 were detected by anti-GFP and anti-P-S180 antibodies respectively. Bfa1S180A/S150A served as a control for the specificity of anti-P-S180 antibody. A representative blot out of three independent experiments is shown. (D) Box and Whisker plots of Bfa1-GFP fluorescence intensity at SPBs in kar9Δ, spc72Δ and kar9Δ kin4Δ cells with correctly and mis-aligned spindles. Within the same cell, the SPB with stronger and weaker Bfa1 fluorescence intensity were classified as SPB1 and SPB2, respectively. The maximum Bfa1-GFP fluorescence intensity of each data set was normalized to 1. The boxes show the lower and upper quartiles, the whiskers show the minimum and maximal values excluding outliers; outliers (shown as dots) were calculated as values greater or lower than 1.5 times the interquartile range; the line inside the box indicates the median. For each box, 33 SPBs were quantified. Asterisks show significant difference according to student’s t-test (p<0.01). See the accompanying data file for exact p-values (Figure 5—source data 1).
DOI: http://dx.doi.org/10.7554/eLife.14029.033

