. 2016 Apr 14;5:e07596. doi: 10.7554/eLife.07596

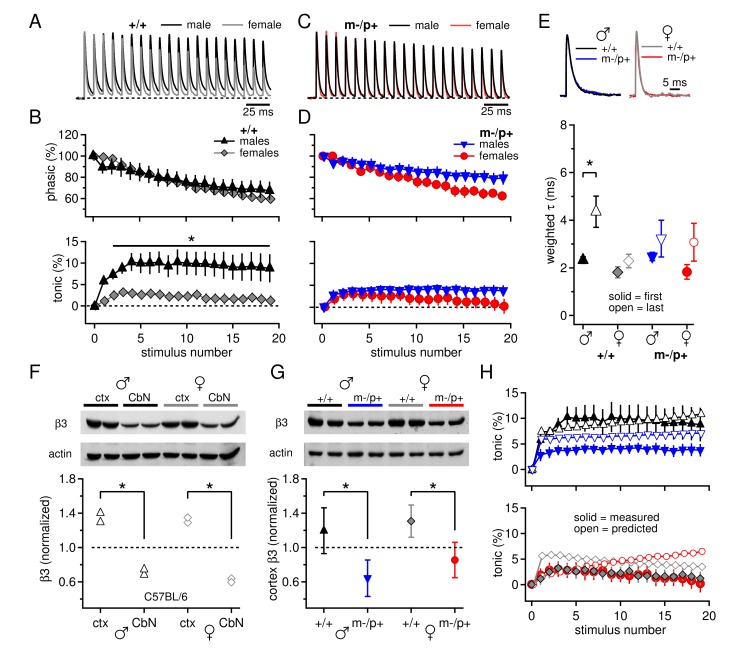
Figure 1. Sex differences in CbN synaptic currents and sex-specific responses to the Gabrb3 m-/p+ mutation.

(A) 100-Hz trains of synaptic currents evoked in CbN cells from male and female wild-type mice, normalized to the first peak. Dotted line, baseline holding current. (B) Mean amplitudes of phasic (upper panel) and tonic (lower panel) synaptic currents as a percentage of the first peak synaptic current vs. stimulus number. Dotted line, 0 current. (C,D) As in A, B, but for cells from male and female m-/p+ mice. (E) Top: example IPSCs evoked by a single stimulus, normalized to the peak current. Bottom: Solid symbols: weighted τdecay for IPSCs from a single stimulus. Open symbols: weighted τdecay for the last IPSC in the train. (F) Representative blot (top) and quantification (bottom) for β3 subunit expression in the cerebellar cortex vs. the cerebellar nuclei in C57BL/6 mice. Each symbol represents the normalized value for one lane. (G) Representative blot (top) and quantification (bottom) for normalized β3 subunit protein expression in the cerebellar cortex of Gabrb3 mice. (H) Solid symbols: measured tonic current, re-plotted from (B) and (D). Open symbols: predicted tonic current, calculated from the weighted τdecay of the first and last IPSCs. Symbol color code as in (E). In all figures, data are plotted as mean ± SEM. Asterisks indicates statistically significant differences.

DOI: http://dx.doi.org/10.7554/eLife.07596.003

Figure 1.

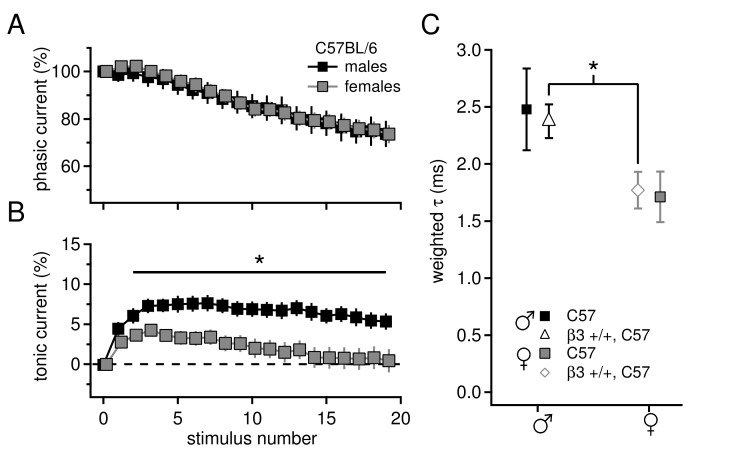
Figure 1—figure supplement 1. Sex differences in tonic current and IPSC decay kinetics in C57BL/6 mice.

Figure 1—figure supplement 1.

(A) Phasic current, as a percentage of initial IPSC amplitude, over 20 stimuli for C57BL/6 males (n=16) and females (n=16). The curves do not differ between males and females (p=0.9). (B) Tonic current, as a percentage of initial IPSC amplitude, over 20 stimuli for C57BL/6 males and females. Females have significantly less tonic current than males (p=0.015). (C) Weighted decay time constants for IPSCs recorded from CbN cells of males and females for C57BL/6 mice (closed symbols). Males tended to have slower decay times than females (males 2.5 ± 0.4 ms, n=11; females 1.7 ± 0.2 ms, n=9; p=0.088). Decay times for C57 males and Gabrb3 +/+ males were not significantly different (p=0.7), nor were decay times for C57 females and Gabrb3 +/+ females (p=0.8). Combining the datasets for sex-matched wild-type cells (open symbols) demonstrates that IPSC decay times are significantly faster in females than in males (males 2.4 ± 0.1, n=33; females 1.8 ± 0.2, n=21; p=0.008).

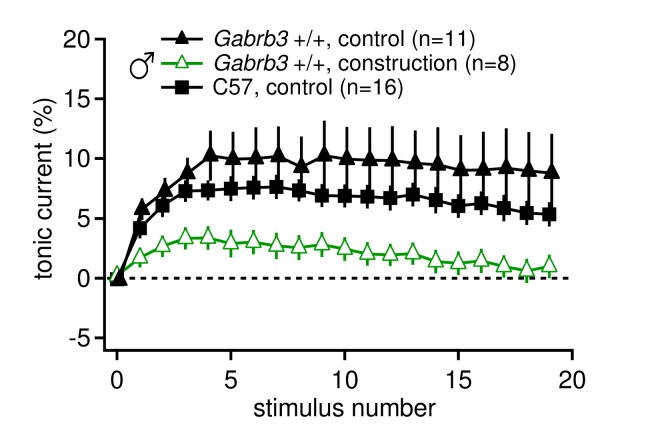
Figure 1—figure supplement 2. Tonic synaptic current, likely mediated by mGluR1/5, may be modulated by environmental conditions such as chronic stress.

Figure 1—figure supplement 2.

Tonic current, as a percentage of initial IPSC amplitude, for 20 stimuli at 100 Hz for Gabrb3 +/+ male mice before (control) and during construction (construction), and C57BL/6 control male mice. Nearby construction caused daily intense vibrations in the facility where mice were housed. Tonic currents from CbN cells of mice born after construction began (open green triangles, 'construction') were significantly smaller than tonic currents from mice born and recorded from before construction began (black triangles, control, re-plotted from Figure 1, p=0.040 vs. 'construction'). C57BL/6J male mice were not bred and housed on site (black squares) and had similar tonic currents to control Gabrb3 +/+ mice (p=0.26).