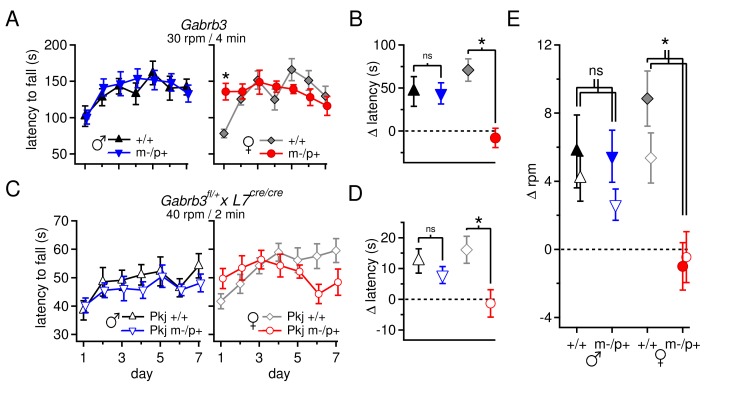
Figure 6. Performance on the accelerating rotarod varies with sex and Gabrb3 and depends on GABAAR β3 expression only in Purkinje cells.
(A) Latency to fall vs. training day for Gabrb3 P22 males (left) and females (right). (B) Change in latency, calculated as the difference between the Day-1 fall latency and mean Day 5–7 fall for all four groups. Symbol color code as in (A). (C) Latency to fall vs. training day for P22 Purkinje-specific Gabrb3 P22 males (left) and females (right). (D) Change in latency, calculated as the difference between the Day-1 fall latency and mean Day 5–7 fall for Purkinje-specific Gabrb3 mice. Symbol color code as in (C). (E) Change in the rotation rate (in rpm) at which the mouse fell on Day-1 vs. mean Day 5–7 for global Gabrb3 mice (closed symbols) and Purkinje-specific Gabrb3 mice (open symbols).


