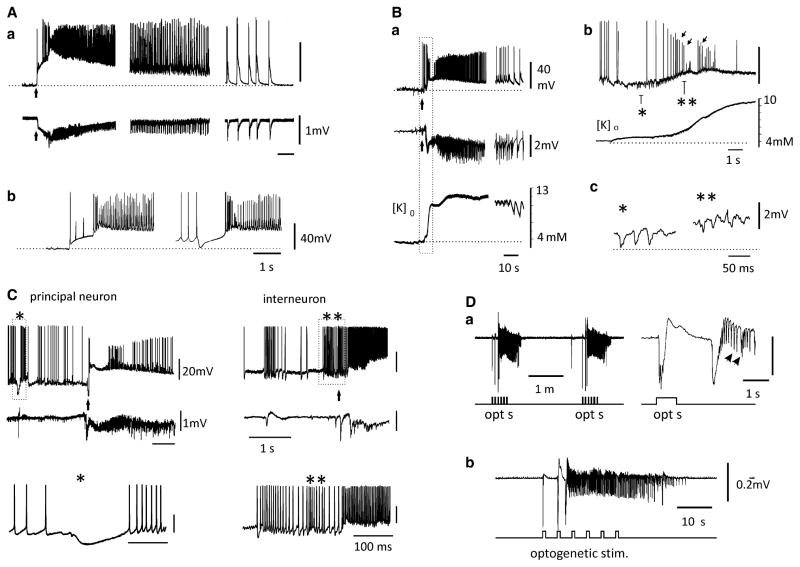
Figure 3.
Focal seizure patterns in different in vitro models of focal seizures. (A) Seizure-like activity in a slice of the rat entorhinal region induced by 4-aminopyridine. In Aa, intracellular (upper traces) and extracellular field recordings (lower traces) are illustrated. Seizure onset is marked by the vertical arrows. Spaces between the traces indicate time lapses of about 20 s. In Ab, intracellular recording during a different seizure-like event; note that depolarizing the membrane potential with intracellular injection of positive current (right trace) reveals a robust hyperpolarizing inhibitory potential at the onset of the seizure. Resting membrane potentials marked by the dotted line: a: −76 mV; b = −78 mV. In both a and b, the intracellular recording was obtained from a principal cell. (B) Acute seizure induced by arterial perfusion of 50 μM bicuculline in the entorhinal cortex of the in vitro isolated guinea pig brain (modified from Gnatkovsky et al. 200831). Intracellular recording from a principal neuron, extracellular field response, and changes in the extracellular potassium ([K+]o) are shown in Ba at the onset of a seizure (arrow). In Bb, the intracellular potential and the potassium changes outlined in the dotted box in Ba are expanded. Small-amplitude, possibly ectopic spikes during the rising phase of [K+]o are marked by the small arrows. Traces of low-voltage fast activity recorded intracellularly marked by the asterisks in Bb are further expanded in Bc. During the initial phase of the seizure, the membrane potential depolarizes and the amplitude of the fast inhibitory potentials decreases, suggesting a change in GABA chloride reversal potential. Resting membrane potential marked by the dotted line in a and c = −59 mV. (C) Seizure-like event recorded in the entorhinal cortex of the isolated guinea pig model during arterial perfusion of 50 μM 4-aminopyridine. On the left, extracellular (lower traces) and intracellular recordings from a principal neuron (upper traces) show that the ictal discharge is preceded by preictal population spikes associated with a hyperpolarizing potential (marked by the dotted outline and expanded in the lower trace). The inhibitory potentials associated with the preictal spikes show the typical reversal of inhibitory postsynaptic potential. Traces shown in the right panel are courtesy of Gianluca Breschi. Increased activity of an entorhinal cortex interneuron at seizure onset are shown in the right panels. (D) In the presence of 4-aminopyridine optogenetic activation of GABA-releasing parvalbumin-positive interneurons in a mouse entorhinal cortex slice induces ictal discharges; note that these extracellular field potential recordings are similar to those occurring spontaneously in the rat brain slice. Courtesy of Zahra Shri, Fred Manseau, Maxime Lévesque and Sylvain Williams.

