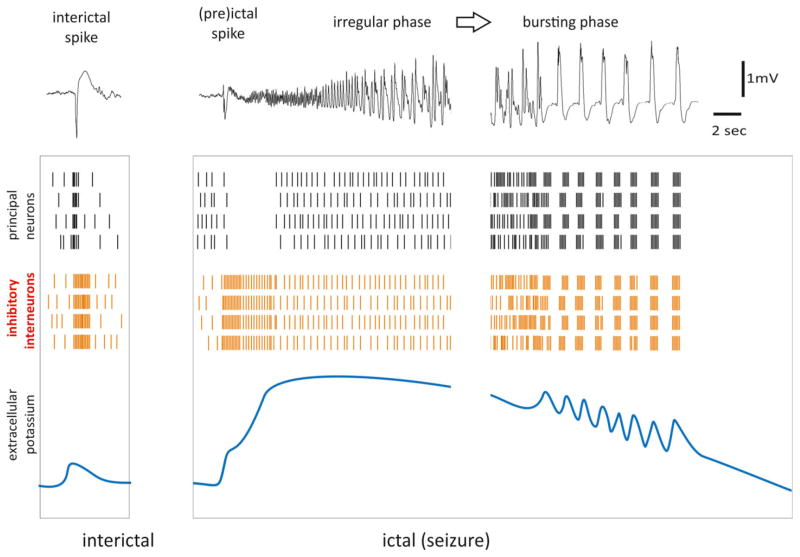
Figure 4.
Schematic model of focal ictogenesis. Representative traces of interictal and ictal discharges recorded extracellularly are shown on top. Action potential firing of principal neurons and interneurons is illustrated by black and red vertical bars, respectively. Changes in the extracellular potassium concentration are represented by the blue line. See text for the explanation.

