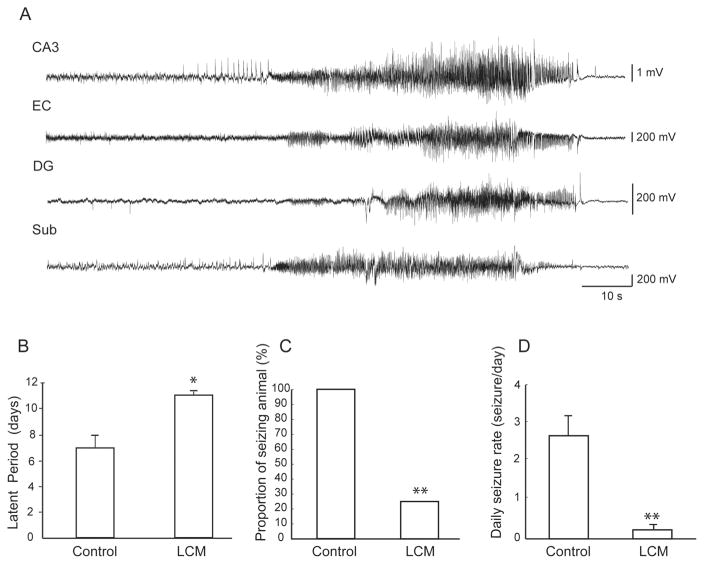
Figure 1.
Effect of lacosamide on the occurrence of seizures—A. Representative example of a seizure recorded in control animals in the right CA3, right EC, left DG and left subiculum. B. Bar graph showing the average duration of the latent period in controls and in LCM-treated animals. LCM-treated animals showed a significantly longer latent period (* p < 0.05). C. Bar graph representing the proportion of seizing animals in each group, this proportion was significantly higher in the control group (Fisher’s exact test, ** p < 0.01). D. Bar graph showing average daily seizure rates in animals with seizures in each group. CA3: CA3 region of the hippocampus, EC: entorhinal cortex, DG: dentate gyrus, Sub: subiculum.

