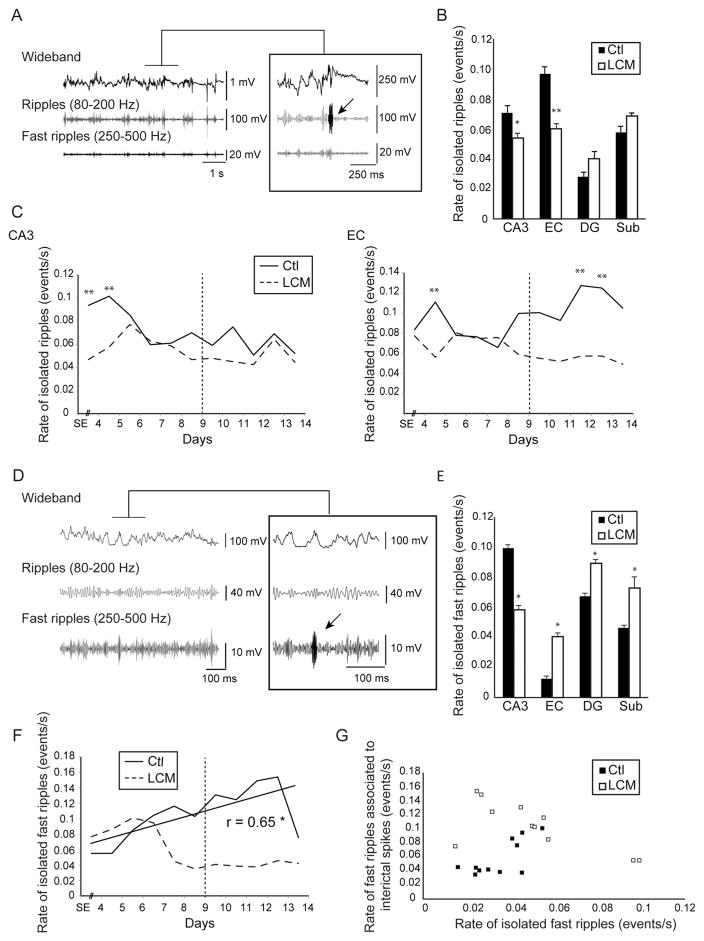
Figure 5.
Effect of lacosamide on isolated high-frequency oscillations—A. Example of an isolated ripple (arrow) recorded in a control animal. B. Bar graph showing the average rate of isolated ripples in both groups. Note that significantly lower rates of isolated ripples were observed in CA3 and EC in the LCM-treated group compared to the control group. C. Average rates of isolated ripples in CA3 and EC from day 4 to day 14 after SE in both groups. D. Representative example of an isolated fast ripple (arrow) recorded in a control animal. E. Bar graph showing the average rate of isolated fast ripples in both groups. Note that significantly lower rates of isolated fast ripples were observed in CA3 in the LCM-treated group compared to the control group. F. Average rates of isolated fast ripples in CA3 from day 4 to day 14 after SE in both groups. No significant differences were observed between groups. (* p < 0.05, ** p < 0.01) (Vertical dotted lines define the averaged peak of seizure occurrence in control animals, around day 9 after SE). G. Scatter plot showing the relation between fast ripples associated with interictal spikes and isolated fast ripples in CA3. No significant relationship was found in both groups.

