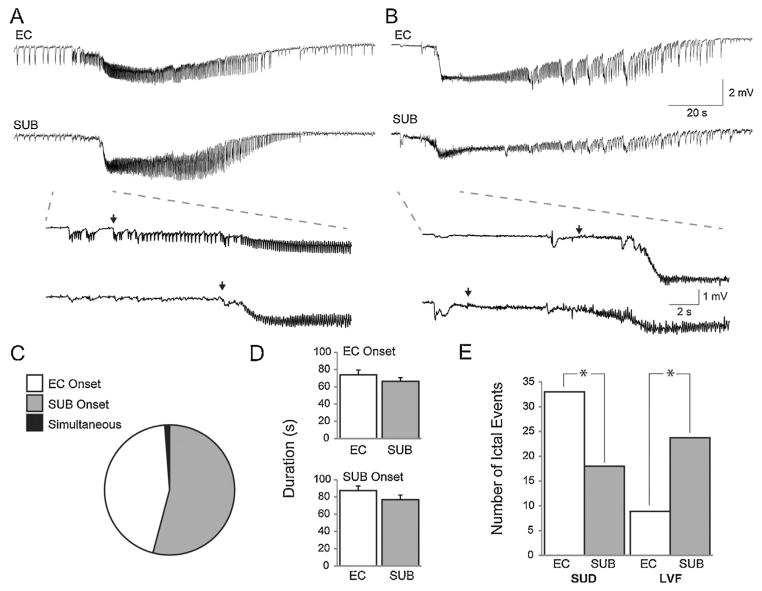
Fig. 1.
Different ictal onset patterns recorded from the EC and subiculum. (A) Example of a sudden onset ictal event with the onset period expanded below. Single arrows represent ictal onset points. (B) Example of an LVF onset ictal event, again with the onset period expanded below. (C) Pie chart representing the proportion of ictal events initiating in subiculum, EC, or simultaneously in both regions. (D) Bar graphs showing the duration of ictal events in the EC and subiculum based on the region in which they were first detected. (E) Proportion of sudden onset and LVF onset ictal events that appeared to initiate in either the EC (white) or subiculum (grey) (*P < 0.001, Fisher’s Exact Test).

