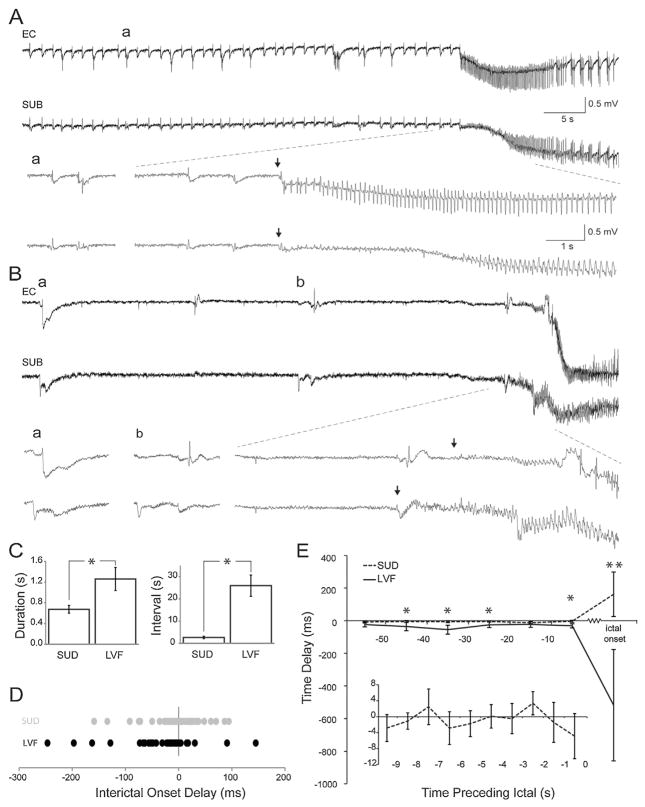
Fig. 2.
Delays between interictal discharges in relation to the time preceding sudden and LVF ictal onset patterns. (A) Frequent polyspike interictal discharges precede a sudden onset ictal event. Single arrows represent ictal onset points. (B) Interictal discharges preceding an LVF onset ictal event. (C) Bar graphs showing the duration and the interval of occurrence of interictal events based on the ictal onset pattern they are associated with. (D) Chart showing the distribution of time delays between the entorhinal cortex and subiculum at the interictal event immediately preceding the ictal event. Negative values indicate that the subiculum leads the entorhinal cortex whereas positive values indicate that the entorhinal cortex leads the subiculum. Each dot represents a single interictal event. (E) Line graph depicting average delays between synchronized interictal events in 10 s time bins preceding the ictal event. Time 0 represents the interictal event immediately preceding the ictal event. Positive values indicate that the event initiates in the entorhinal cortex and negative values indicate that the event initiates in the subiculum. The inset shows an expansion of the time bin preceding ictal onset for sudden onset events only (*P < 0.05; **P < 0.001).

