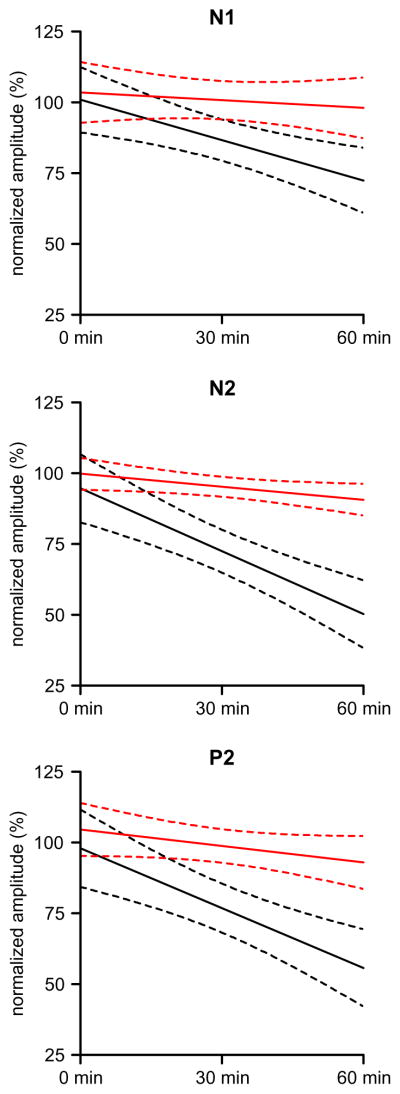
Fig. 2.
Regression lines for tramadol (black) and placebo (red) sessions. In the placebo session the slope was never significantly different from zero. In the tramadol session the slope was significantly different from zero for all the three LEP components, but the N2 and P2 slopes were steeper than that of N1 (p < 0.001).

