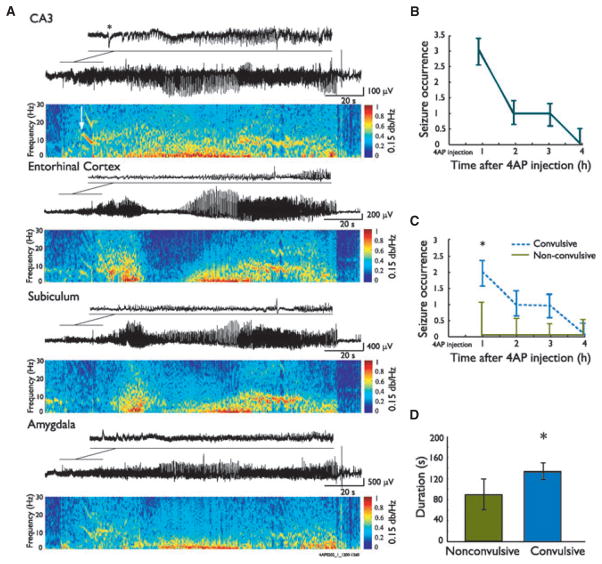
Figure 3.
Ictal activity induced by systemic 4AP administration. (A) Representative seizure recorded after 4AP systemic administration from four structures simultaneously. Note at seizure onset the occurrence of a negative spike (asterisk) in the CA3 region of the hippocampus, followed by the occurrence of fast activity in the 5–20 Hz range; this spike is mirrored by a positive-going spike in the amygdala. The white arrow in the power spectrogram indicates seizure onset time, based on the first occurrence of fast activity. During this seizure, fast activity first occurred in CA3, which was considered as the seizure-onset zone. (B) Rate of seizures per hour recorded after 4AP in 12 animals. (C) Duration of convulsive and nonconvulsive seizures over time after 4AP in these 12 rats. Note that the occurrence of convulsive seizures was higher during the first hour after 4AP. (D) Bar graph showing the duration of convulsive and nonconvulsive seizures recorded from these 12 animals; note that convulsive seizures lasted significantly longer compared to nonconvulsive seizures. Medians and 95% confidence intervals are shown. *p < 0.005.

