. 2016 May 18;30(3):163–171. doi: 10.3341/kjo.2016.30.3.163

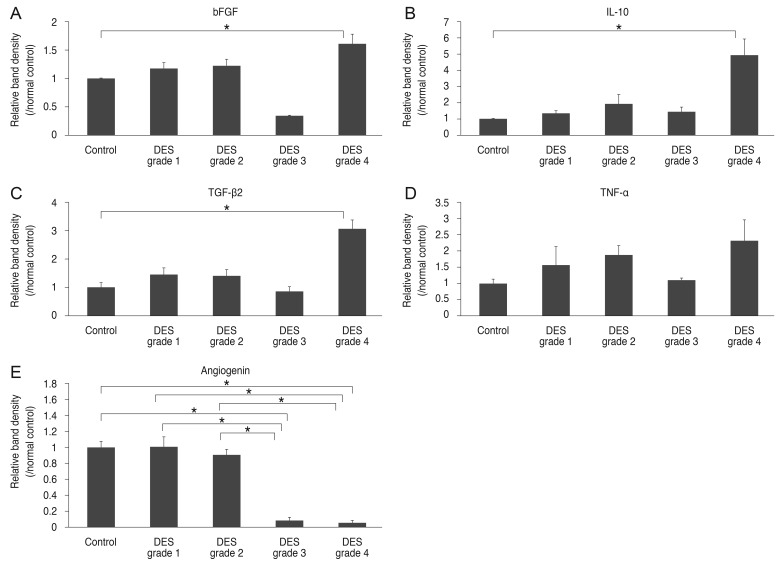
Fig. 2. The relative density, presented as the average amount of each cytokine expressed in each dry eye syndrome (DES) severity grade group relative to that in the normal control group. (A-C) The areas of basic fibroblast growth factor (bFGF) (A), interleukin (IL)-10 (B), and transforming growth factor (TGF)-β2 (C) were significantly greater than those of normal controls only in grade 4 DES patients. (D) There was no significant difference of tumor necrosis factor (TNF)-α expression according to the grades of DES. (E) The areas of angiogenin in DES grade 3 and 4 patients were significantly lower than those of normal controls and DES patients of grades 1 and 2 (*p < 0.05).

Fig. 2