Fig. 4.
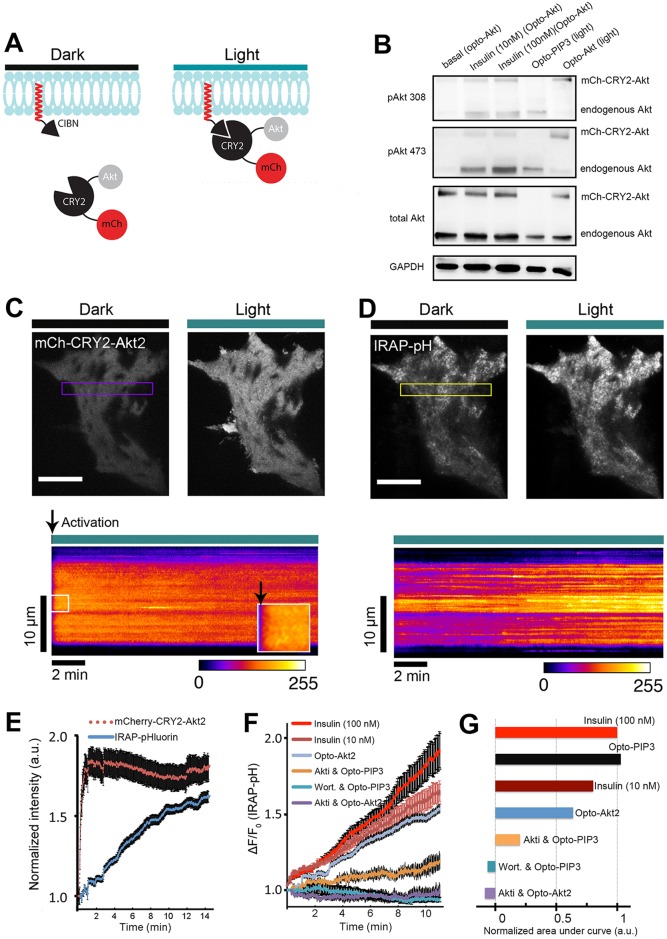
Light-induced Akt relocation to the plasma membrane triggers GLUT4 translocation. (A) Schematic representation of chimeric CIBN and CRY2 constructs used in this study. (B) Light- and insulin-induced activation of mCherry–CRY2–Akt2 (mCh–CRY2–Akt). Cell lysates were immunoblotted for proteins as indicated. pAkt 473 and pAkt308, Akt phosphorylated at Ser473 and Thr308, respectively. (C) Rapid relocation of Akt fusion proteins to the cell surface after light activation. TIRF images show mCherry-tagged Akt fusion proteins before and after one pulse of blue light (488 nm, 10 mW) activation in a 3T3-L1 adipocyte. Kymograph of the boxed area is shown underneath. Arrowheads show when the light activation started. (D) Opto-Akt stimulates IRAP–pHluorin exocytosis. 3T3-L1 adipocytes were electroporated with CIBN–CaaX, mCherry–CRY2–Akt2 and IRAP–pHluorin plasmids. The cells were activated with 500-ms pulses of blue light (488 nm, 10 mW) at 5-s intervals under TIRFM illumination, and GLUT4 translocation was evaluated using pHluorin signals on the cell surface. TIRF images show IRAP–pHluorin signals before and 10 min after light activation. The kymograph of the boxed area shows the dynamics of IRAP translocation. (E) Quantification of light-induced redistribution of mCherry-tagged Akt2 fusion proteins and IRAP–pHluorin to the cell surface (n=5 cells, data are mean±s.e.m.). (F) Quantification of IRAP translocation under the conditions indicated (from top to bottom) (n=5 cells, data are mean±s.e.m.). (G) Quantification of the areas under each curve in Fig. 4F, normalized to that of the 100-nM insulin curve. Scale bars: 10 μm (C,D).

