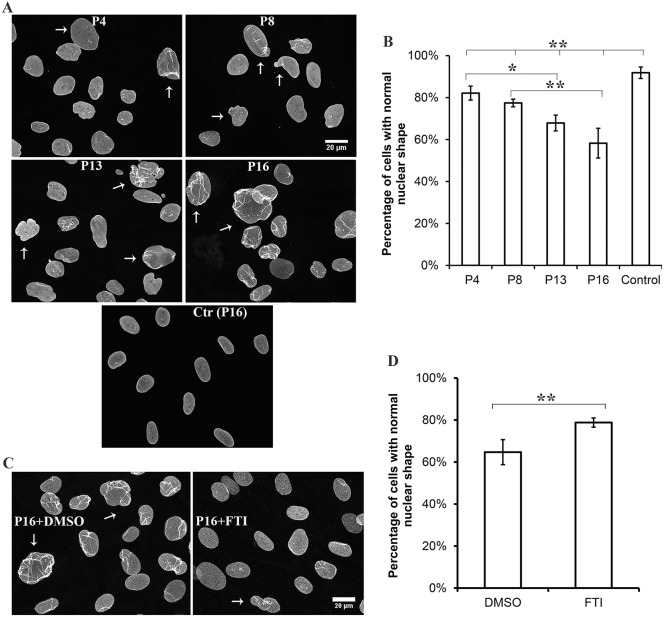
Fig. 3.
Abnormal nuclear morphology in the individual's fibroblasts and effects of FTI treatment. (A) Immunofluorescence micrographs of the individual's cultured fibroblasts labeled with anti-lamin-A/C antibodies after passage 4 (P4), 8 (P8), 13 (P13) and 16 (P16); control fibroblasts are also shown at passage 16 [Ctr (P16)]. Arrows indicate representative morphologically abnormal nuclei. (B) Percentages of normal-shaped nuclei in cultures from individual fibroblasts after each indicated passage and for control cells at passage 16. (C) Immunofluorescence micrographs of the individual's cultured fibroblasts labeled with an anti-lamin-A/C antibody after passage 16 (P16) and treated with either the placebo DMSO or FTI for 72 hours. Arrows indicate representative morphologically abnormal nuclei. (D) Percentages of normal-shaped nuclei in cultures of the affected individual's fibroblasts at passage 16 after treatment with placebo (DMSO) or FTI. For quantification, nuclei in 200–800 cells of 5–10 microscopic fields per sample were scored as having normal or abnormal morphology by an independent observer with experience in cell biology that was blind to the experiment. This person was unaware of cell passage number and drug treatment. Information about features counted as abnormal, including representative images, is provided in Fig. S1. Values in B,D are means±s.e.m.; *P<0.05, **P<0.01 (two-tailed Student's t-test with unequal variance). The bar at the top of panel B indicates the differences between the individual's cells at P4, P8, P13 and P16 compared to control.

