
Figure 7.
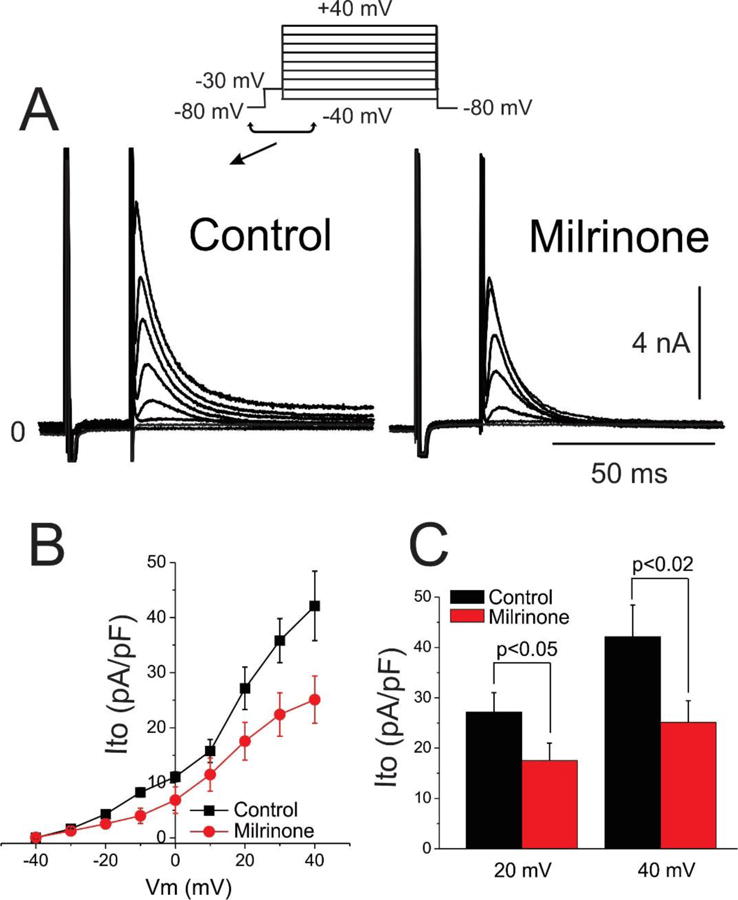
Milrinone inhibition of transient outward potassium current (Ito). A. Representative macroscopic Ito current traces for control and milrinone (2.5 μM). B. Current-Voltage (I–V) relationship for Ito density in control and in response to 2.5 μM milrinone (n=8 for each). C. Bar graph showing Ito at following a step to 20 and 40 mV in presence and absence of milrinone (2.5 μM). Mean ± SEM.