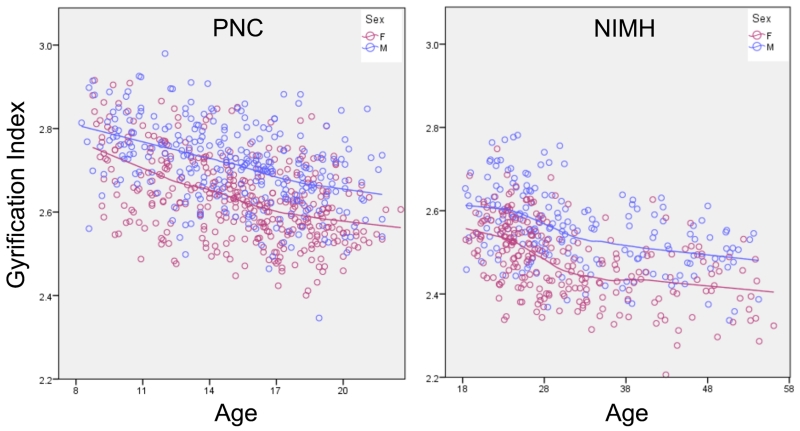
Figure 3. Plot of age versus global gyrification index in each sample.
Left shows the PNC sample of children aged 8-21 and Right shows the NIMH sample of adults aged 18-56. Note the negative association between age and GI in both samples. Blue dots and line represent males, pink represent females. See also Figure S2.

