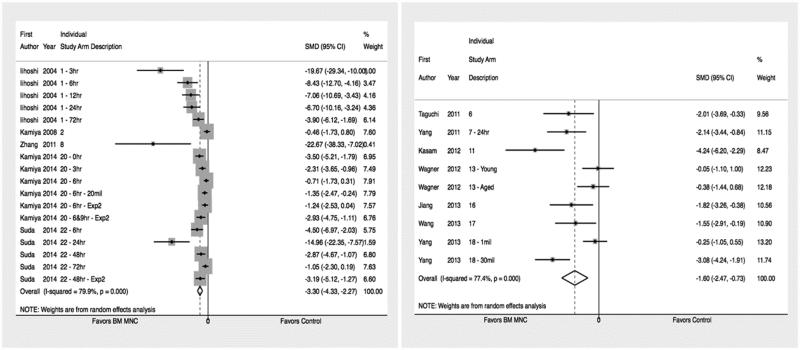
Figure 2a and 2b.
Forrest plot for effect size for IV BM MNCs on absolute reduction (figure 2a) and relative change to the non-infarct side (figure 2b). Weights have been calculated using random effects model. Degree of heterogeneity in the pooled estimates is represented at I2 statistic. The studies included in meta-analysis of absolute5,6,41,54 and relative39,40,44,46,49,50 decrease in infarct size are cited.

