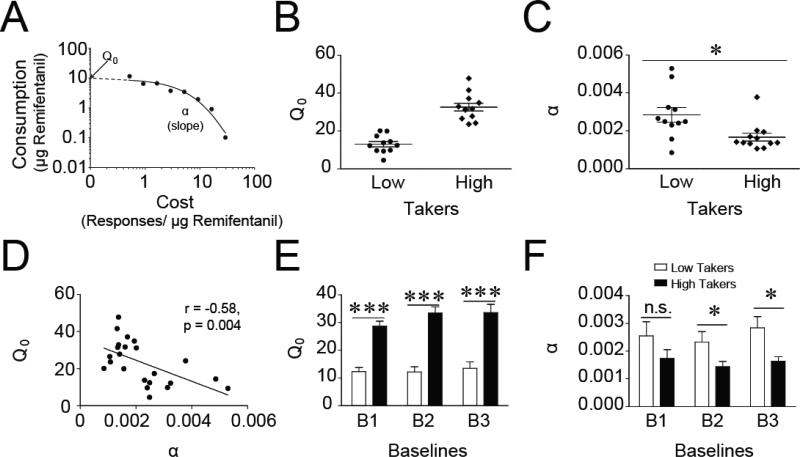
Figure 2. Individual differences in motivation for remifentanil during a within-session behavioral-economic procedure.
A) A representative example of a demand curve for remifentanil of a single animal during a single session. B) To examine individual differences in demand for remifentanil, rats were divided into low (n = 12) and high (n = 12) takers based on Q0. C) High takers exhibited more inelastic responding than low takers as price increased. D) Preferred consumption of remifentanil at null cost (Q0) and demand elasticity (α) correlated with each other with high takers displaying enhanced motivation for remifentanil. E) Individual differences in Q0 were evident consistently throughout training based upon the average stable baseline sessions prior to each SB test. F) Individual differences in α between low and high takers emerged over BE training. *p < 0.05; ***p < 0.001; n.s. = not statistically different.

