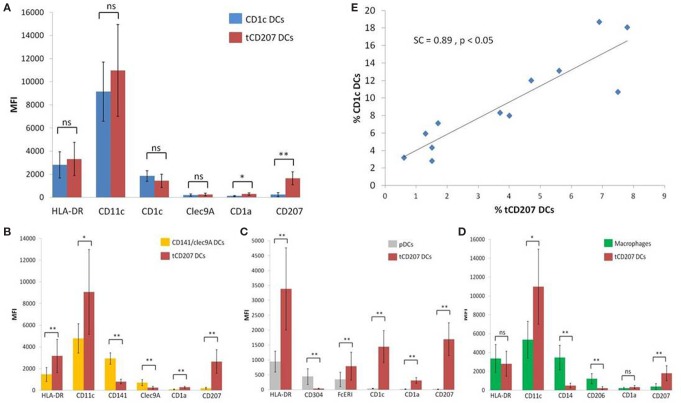
Figure 4.
Comparative analysis of levels of expression of different DC markers on tCD207 and other DC subsets. (A–D) Graphs show the expression levels (MFI) of different indicated DC markers on tCD207 DCs (linnegHLA-DR+CD207+) compared to (A) CD1c DCs (HLADR+CD11c+CD1c+), (B) CD141 DCs (HLADR+CD11c+CD141+Clec9A+), (C) pDCs (HLADR+CD304+), or (D) macrophages (HLADR+CD11c+CD14+). (A–D) Data are expressed as mean MFI values ± SD for 12 independent tonsil samples (10 children and 2 adults). p value comparing two groups (Mann–Whitney U test): *p < 0.05; **p < 0.01; ns: not significant. (E) Correlation between frequencies (%) of tCD207 DCs and CD1c DCs in 12 independent tonsils (10 children and 2 adults). Correlation coefficient of Spearman (SC) and p value are shown.

