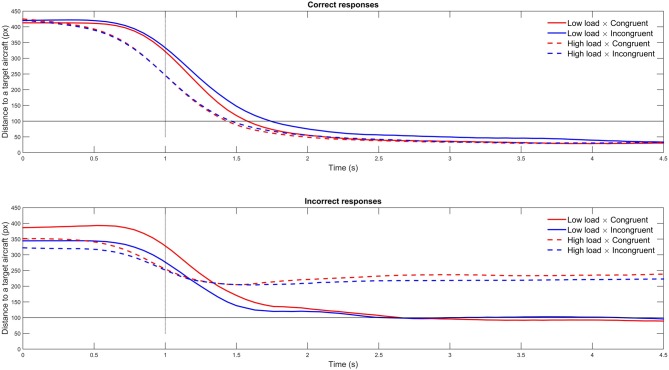
Figure 4.
Mean distance to a target aircraft per condition for correct and incorrect trials. The black horizontal line depicts the threshold below which the aircraft was considered as selected. The vertical dashed black line depicts the time when the written instruction disappeared from the computer screen.

