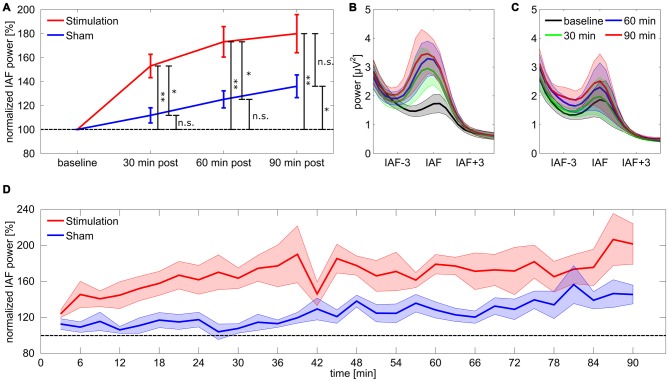
Figure 2.
Power change in the individual alpha band. (A) Post period increase in the individual alpha band. Stars coding for significant differences (* < 0.05, ** < 0.01). Error bars reflect standard error of the mean (SEM), the dashed line reflects baseline level. (B,C) Spectra for stimulation (B) and sham (C) group aligned on IAF and averaged over subjects. (D) Time course of normalized power in the individual alpha band for stimulation and sham group. Shaded areas around the lines depict SEM, the dashed line reflects baseline level.

