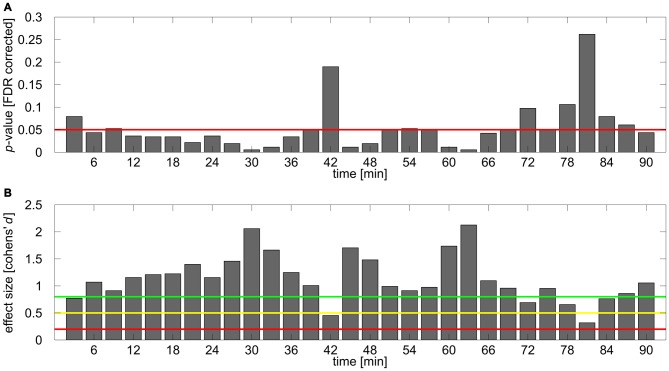
Figure 4.
Results of post hoc analysis. (A) FDR corrected p-values for the comparison of normalized IAF band power between stimulation and sham group for each time bin. Red line depicts 0.05 significance boundary. (B) Corresponding effect sizes (Cohen’s d) for each of the comparisons. Colored lines depict suggestions for small (d = 0.2; red line), medium (d = 0.5; yellow line) and large (d = 0.8, green line) effects given by Cohen (1992).

