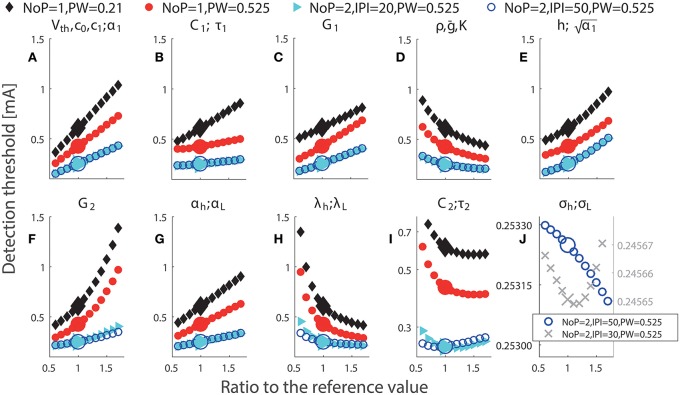
Figure 3.
Simulated detection thresholds with perturbation of single parameters. The parameter changed in a particular panel is displayed above panels (A–J). Black: NoP = 1, PW = 0.21 ms; Red: NoP = 1, PW = 0.525 ms; Cyan: NoP = 2, IPI = 20 ms, PW = 0.525 ms; Blue: NoP = 2, IPI = 50 ms, PW = 0.525 ms and Gray cross: NoP = 2, IPI = 30 ms, PW = 0.525 ms (only in J). The titles in panels indicate perturbed parameters. In (I), the y-axis has a log-scale for better visualization of the non-monotonicity of detection thresholds with respect to C2 or τ2. In (J), the y-axis has different scales for better visualization of the non-monotone effects of σh and σL for two combinations of temporal properties, respectively.

