
Figure 2.
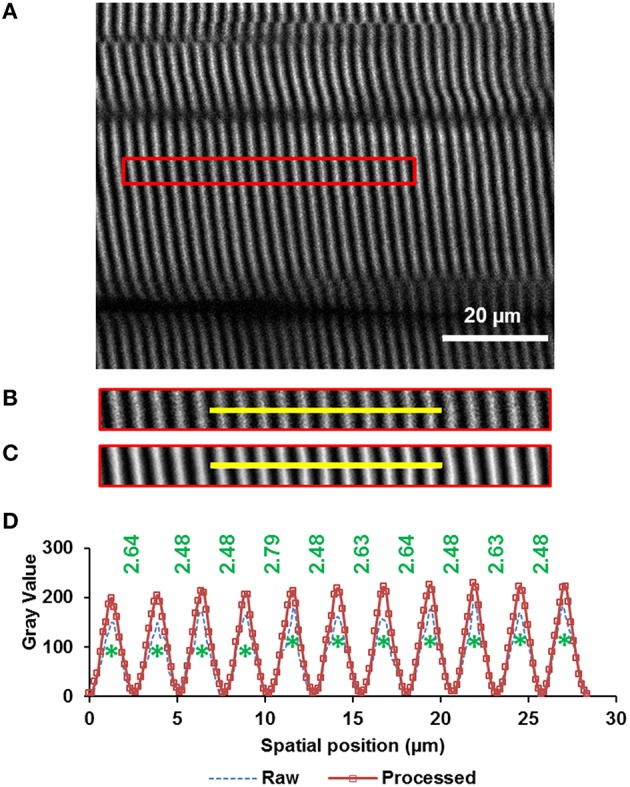
Sarcomere lengths were measured from images obtained by second harmonic generation (SHG). The A-bands appear as white bands in the image. The image was taken from the middle site of the TA muscle of mouse #4 (see “Supplementary Materials,” Table S1) during full plantarflexion of the ankle joint. (A) A representative region of interest of 30 pixels wide that contains 20 sarcomeres (indicated by the red rectangle) was selected from the images (see text in Methods for details), (B) raw image, and (C) filtered image of the selected region. The image was filtered by a patch-based de-noising algorithm (Chatterjee and Milanfar, 2012), (D) Intensity profiles across the yellow line highlighted in the raw (dotted blue line) and filtered (rectangle symbols on solid red line) muscle image. The centroids of all A-bands (green asterisks) were identified using a custom-written MATLAB code. Individual sarcomere lengths were calculated as the distance (in micrometer) between adjacent A-band centroids.