
Figure 4.
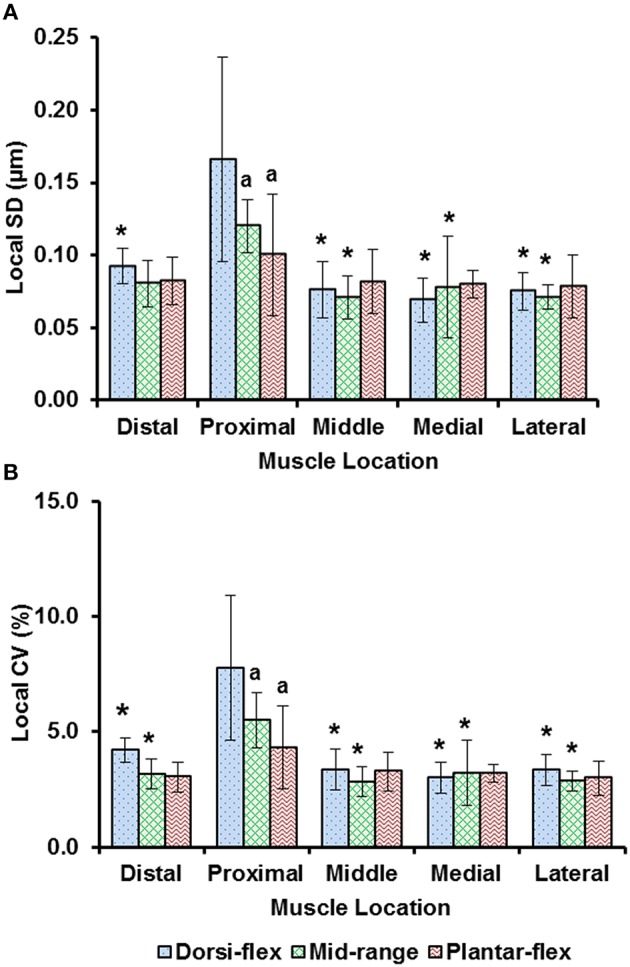
Local dispersion of sarcomere lengths at full dorsiflexion, intermediate ankle angle, and full plantarflexion given by (A) the local standard deviation (SD) and, (B) the local coefficient of variation (CV). For each TA site of 159 × 159 μm, the local dispersion of sarcomere lengths was measured from four representative image bands that were of 4.7 μm wide and contained 15–20 sarcomeres in series. The graphs show the average values of the local SDs (a) and local CVs (b) for the five mice. Sarcomeres at the “proximal” TA site had higher local SD and local CV compared to sarcomeres at the remaining TA sites. *Indicates significant differences in local SD and local CV compared to the sarcomeres at the proximal TA site and a given ankle joint angle (p < 0.05). aIndicates significant differences in local SD and local CV compared to sarcomeres in the fully dorsi-flexed position (p < 0.05; see Section Statistical analysis in the “Methods” for more details).