
Figure 5.
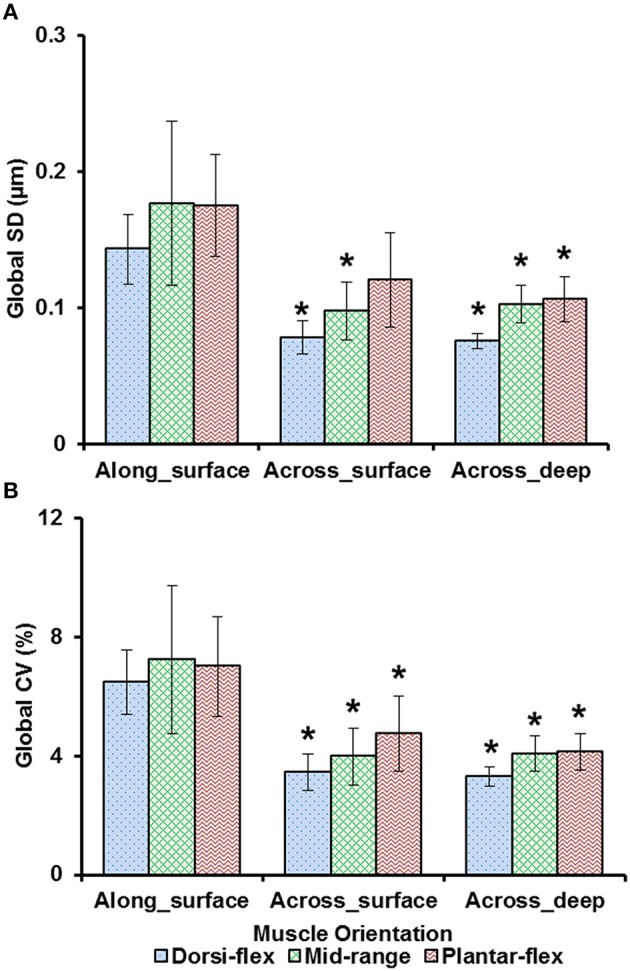
Global dispersion in sarcomere lengths for surface zone and deep zone sarcomeres at full dorsiflexion, intermediate ankle angle, and full plantarflexion. (A) Global standard deviation (SD) and, (B) global coefficient of variation (CV). Sarcomeres from the surface zone were pooled based on TA site, either into measurements along the longitudinal axis (“proximal,” “middle,” and “distal” TA sites) or along the transverse axis of the muscle (“medial,” “middle,” and “lateral”). In addition, sarcomeres from the deep zone that were located along the transverse axis of the TA were analyzed for their dispersions. The graphs show the average of the global SDs and global CVs from the five mice tested. Surface zone sarcomeres along the longitudinal axis of the TA had greater dispersions of length compared to sarcomeres that were aligned along the transverse axis of the TA. *Indicates significant differences in global SD and global CV compared to surface zone sarcomeres that were located along the longitudinal axis of the TA at a given ankle angle (p < 0.05; see Section Statistical Analysis in the “Methods” for more details).