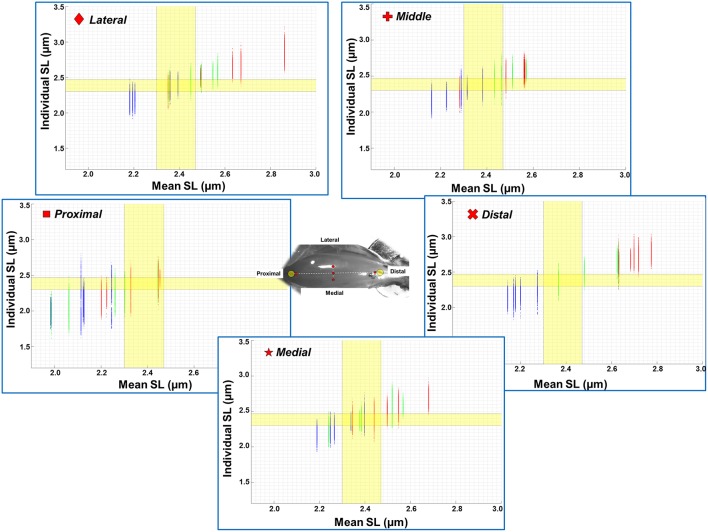
Figure 6.
Scatter plot of individual sarcomere lengths against mean sarcomere lengths across all five TA sites where measurements were made (n = 5). Results are shown for the ankle in a position of full dorsiflexion (blue), intermediate angle (green), and full plantarflexion (red). The optimal range of sarcomere lengths of mouse TA was calculated from the known lengths of the thin and thick myofilaments (Gokhin et al., 2014). The optimal length is identified by the yellow bands (2.30–2.47 μm). The lengths of serially arranged sarcomeres varied substantially even in the small local regions. Individual sarcomere length variability may be underestimated when sarcomere lengths are expressed as mean values across a region, as evidenced by the wider range of sarcomere lengths along the y-axis (individual lengths) compared to those along the x-axis (mean lengths). All data points from all five animals (corresponds to 1200–1500 sarcomeres) are shown in each of the graphs. See Supplementary Materials for scatter plots of each imaging site.

