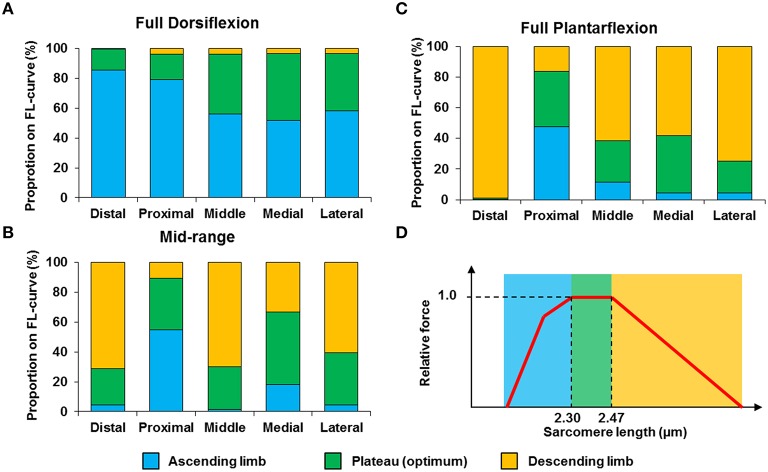
Figure 7.
Proportion of sarcomeres with lengths that fall onto the ascending limb (blue bars), plateau region (green bars) and descending limb (orange bars) of the theoretical force-length curve at (A) full dorsiflexion, (B) intermediate ankle angle, and (C) full plantarflexion. A representative sarcomere force-length curve (red curve) of mouse TA is shown in (D). The theoretical optimal sarcomere length ranges from 2.30 to 2.47 μm (Walker and Schrodt, 1974; Gokhin et al., 2014).

