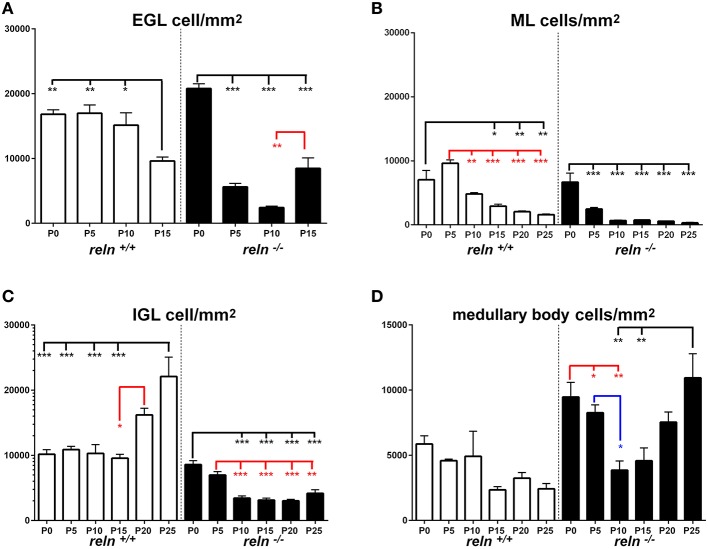
Figure 4.
Comparison of TCD within genotypes. Cortical layers (A–C), medullary body (D). EGL, external granular layer; ML, molecular layer; P, postnatal age; TCD, total cell density after nuclear stain. One-way ANOVA with multiple comparisons; error bars indicate SEM; ***P < 0.001; **P < 0.01; *P < 0.05.

