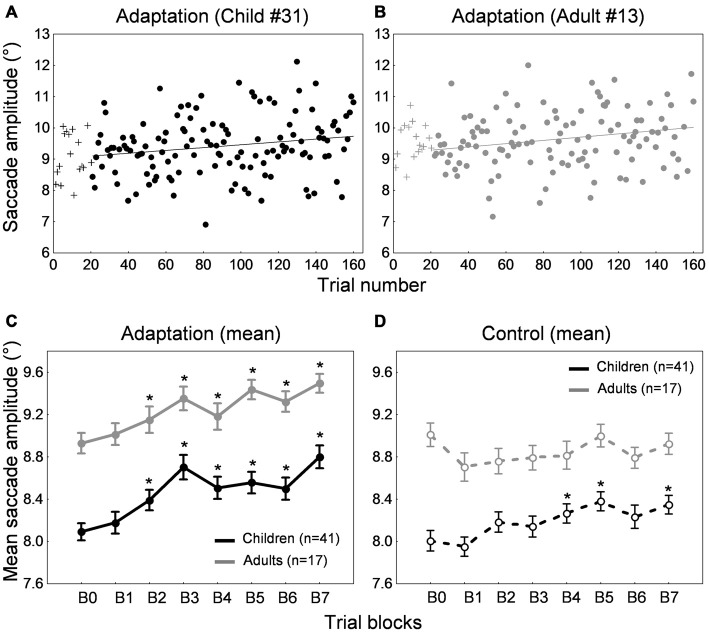
Figure 6.
Forward adaptation experiment. (A,B) Time course of saccade amplitude as a function of trial number in one representative child (33 months-old) and one representative adult (28 years-old) in the adaptation condition. Crosses represent data in the preadaptation 20-trial-block B0. Filled circles represent data on adaptation trials. (C) Mean saccade amplitude as a function of blocks of trials in the child group (black trace) and the adult group (gray trace) in the adaptation condition. Block B0 corresponds to the preadaptation block with no intrasaccadic target step, blocks B1 and B2 to adaptation blocks with an intrasaccadic step of 10% relative to initial target eccentricity, blocks B3 and B4 to adaptation blocks with an intrasaccadic step of 20% and blocks B5 to B7 to adaptation blocks with an intrasaccadic step of 30%. (D) Mean saccade amplitude as a function of blocks of trials in the child group (black trace) and the adult group (gray trace) in the control condition. The eight blocks of trials were similar to the adaptation condition except that there were never intrasaccadic target steps. (C,D) Asterisks illustrate statistically significant differences compared to the first block B0 (post hoc Tukey HSD tests following a significant effect of Block of trials factor in (C), ps < 0.0001; post hoc Tukey HSD tests following a significant Blocks of trials × Age group interaction in (D), ps < 0.05); others: ns. Errors bars represent SEM.

