Figure 7.

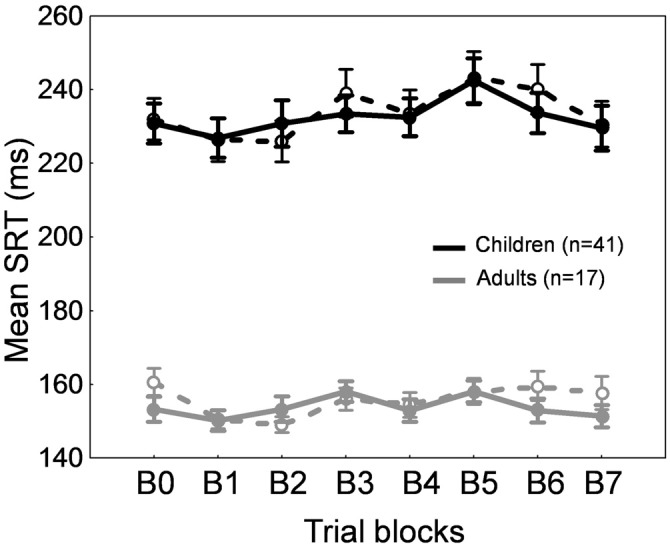
Forward adaptation experiment. Mean saccade reaction time across blocks of trials in children (black traces) and adults (gray traces) for the adaptation condition (solid lines) and the control condition (dashed lines). Errors bars are SEM.

Forward adaptation experiment. Mean saccade reaction time across blocks of trials in children (black traces) and adults (gray traces) for the adaptation condition (solid lines) and the control condition (dashed lines). Errors bars are SEM.