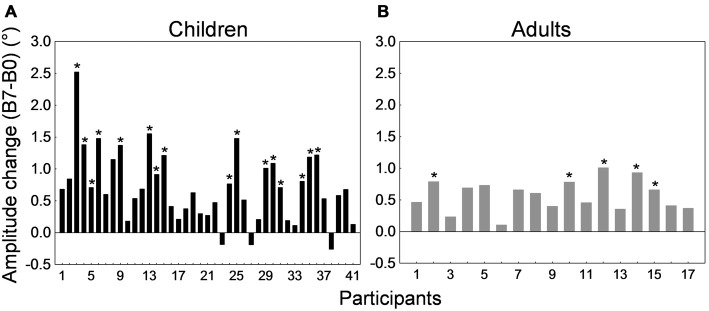
Figure 8.
Forward adaptation experiment. Saccade amplitude change measured by the difference between mean saccade amplitude in block B7 and the mean amplitude in block B0 for all 41 children (A) and all 17 adults (B). Note that in both panels participants were arranged by ascending age to facilitate comparisons. For the child group, the age range was 10–19 months for participants #1 to #3, 21–25 months for participants #4 to #10, 26–29 months for participants #11 to #25, 30–35 months for participants #26 to #35, and 36–38 months for participants #36 to #41. In both panels, asterisks depict statistically significant differences in amplitude between blocks B7 and B0 (t-tests, ps < 0.05). Note that data from child #31 and adult #13 were used to illustrate Figures 6A,B.

