
Figure 9.
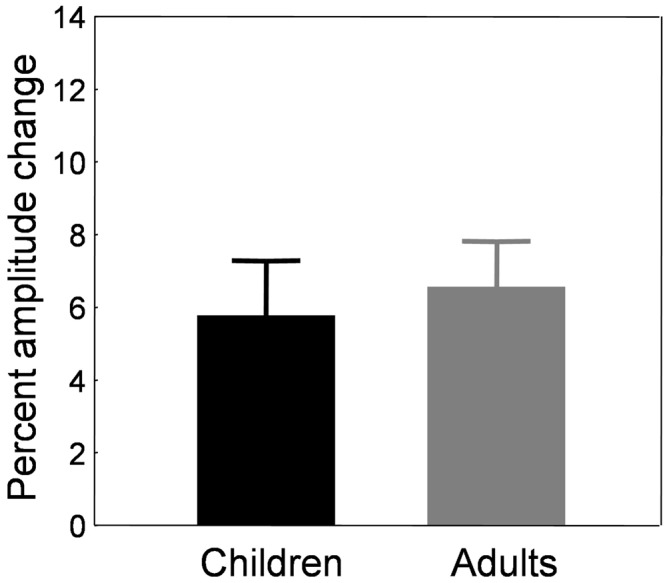
Forward adaptation experiment. Mean percent amplitude change in children (black bars) and adults (gray bars) in the adaptation condition. The baseline used to compute the amount of adaptation was the last control block B7 instead of the preadaptation block B0. See text for rationale and details.