Fig. 2.

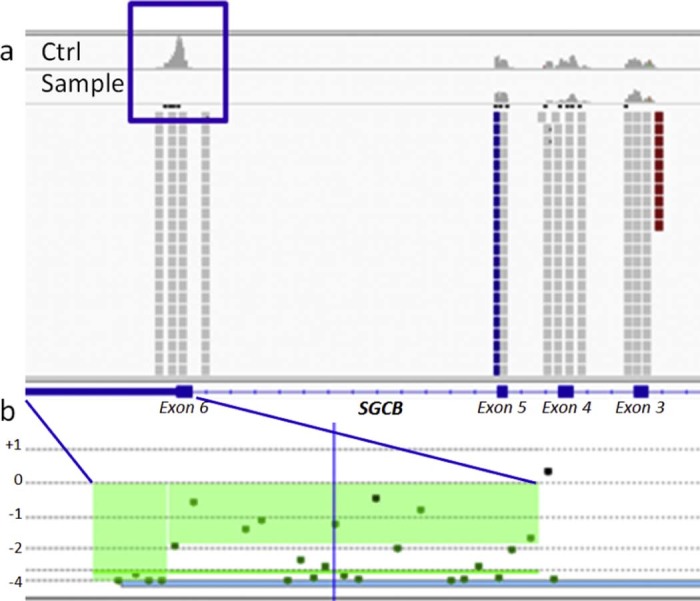
Graphic view of NGS and array CGH results. (a) IGV graphic view of the SGCB gene coverage in a control (upper panel) and in the proband sample (lower panel); (b) Motor Chip profile of the last 12 codons of exon 6 and the 3′UTR SCGB deletion.

Graphic view of NGS and array CGH results. (a) IGV graphic view of the SGCB gene coverage in a control (upper panel) and in the proband sample (lower panel); (b) Motor Chip profile of the last 12 codons of exon 6 and the 3′UTR SCGB deletion.