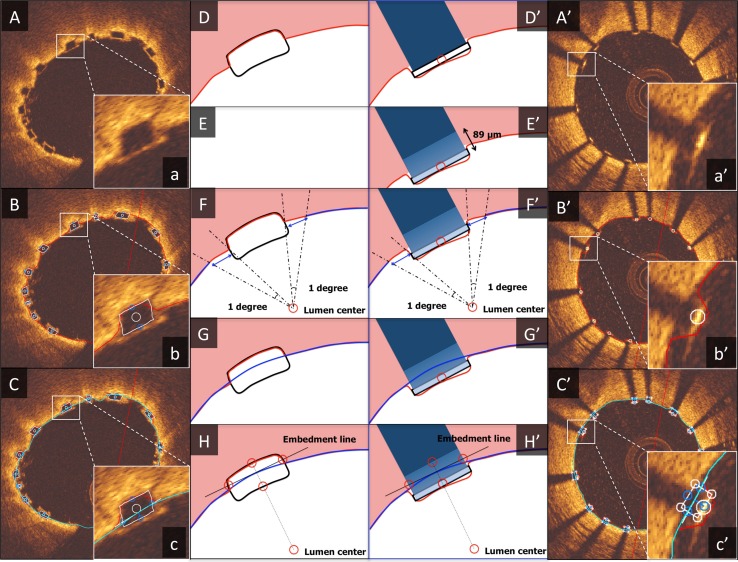
Fig. 1.
Algorithm for embedment analysis. The algorithm for embedment analysis in Absorb BVS (A–H) and XIENCE (A′–H′) is demonstrated in this figure. A–C and A′–C′ indicate the actual analysis display, a–c and a′–c′ show the magnified views of a single strut, and D–H and D′–H′ illustrate the step-by-step algorithm for embedment analysis. As a first step, automatic lumen contour detection and automatic strut detection were performed (D, D′). After detection of the abluminal side of the metallic struts, the entire body of the strut was automatically drawn by simulating the virtual contour of the struts using the thickness of the strut indicated by the manufacturer (XIENCE: 89 μm) (E′). The following steps were the same between Absorb BVS and XIENCE. After erasing a part of the lumen contour surrounding a strut (strut part and bilateral 1 degree measured from the lumen center) (F, F′), interpolated lumen lines were connected through the strut automatically (G, G′). “Embedment Line” was automatically delineated as described in the main text (H, H′). This additional line was used for embedment analysis to compute the following embedment measurements. “Embedment depth” was the distance between the back position of struts and the Embedment Line measured along the line from the back position through the lumen center. “Embedment strut width” was the distance between the intersection point(s) of the Embedment Line and the strut contour

