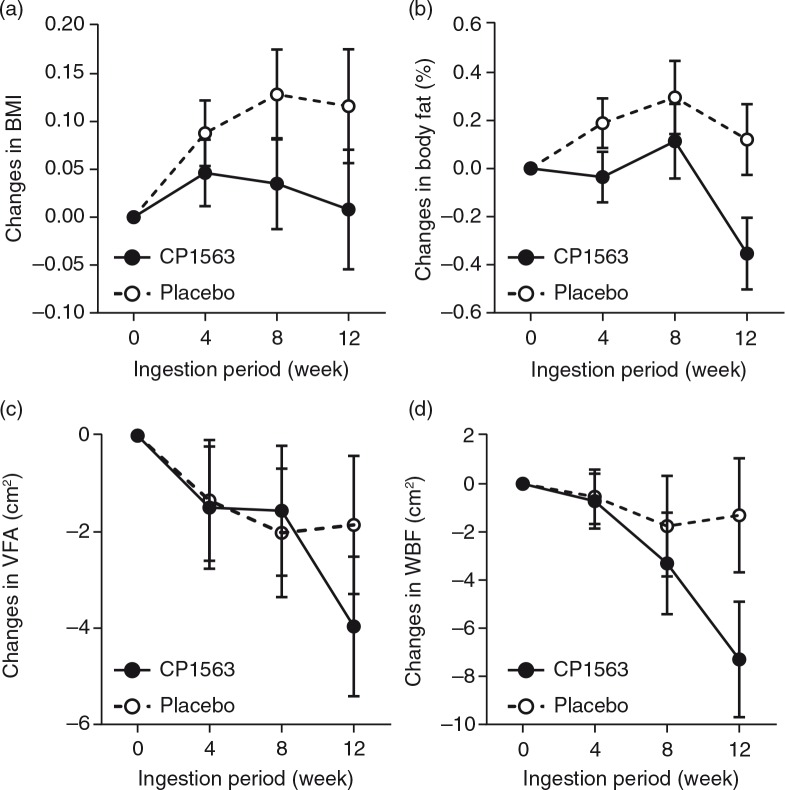
Fig. 2.
Changes in anthropometric measurements. (a) BMI, (b) body fat percentage, (c) visceral fat area, and (d) whole body fat area. Changes in BMI and fat area based on CT scans from baseline in obese class I participants during the 12-week period of consumption in the test group (closed circles; n=100) and the placebo group (open circles; n=100). The participants ingested one bottle (500 mL) of carbonated beverage containing fragmented CP1563 or the same amount of carbonated placebo beverage daily for 12 weeks. After the treatment was initiated, the whole and visceral fat areas were measured at weeks 4, 8, 12 and 16. Subgroup analysis was performed after the groups were divided into two subgroups using 100 cm2 of visceral fat area as the cutoff value. The data are presented as the means±SEM. Statistical significance was determined according to the interaction of the factor group×time using ANCOVA for repeated measures.

