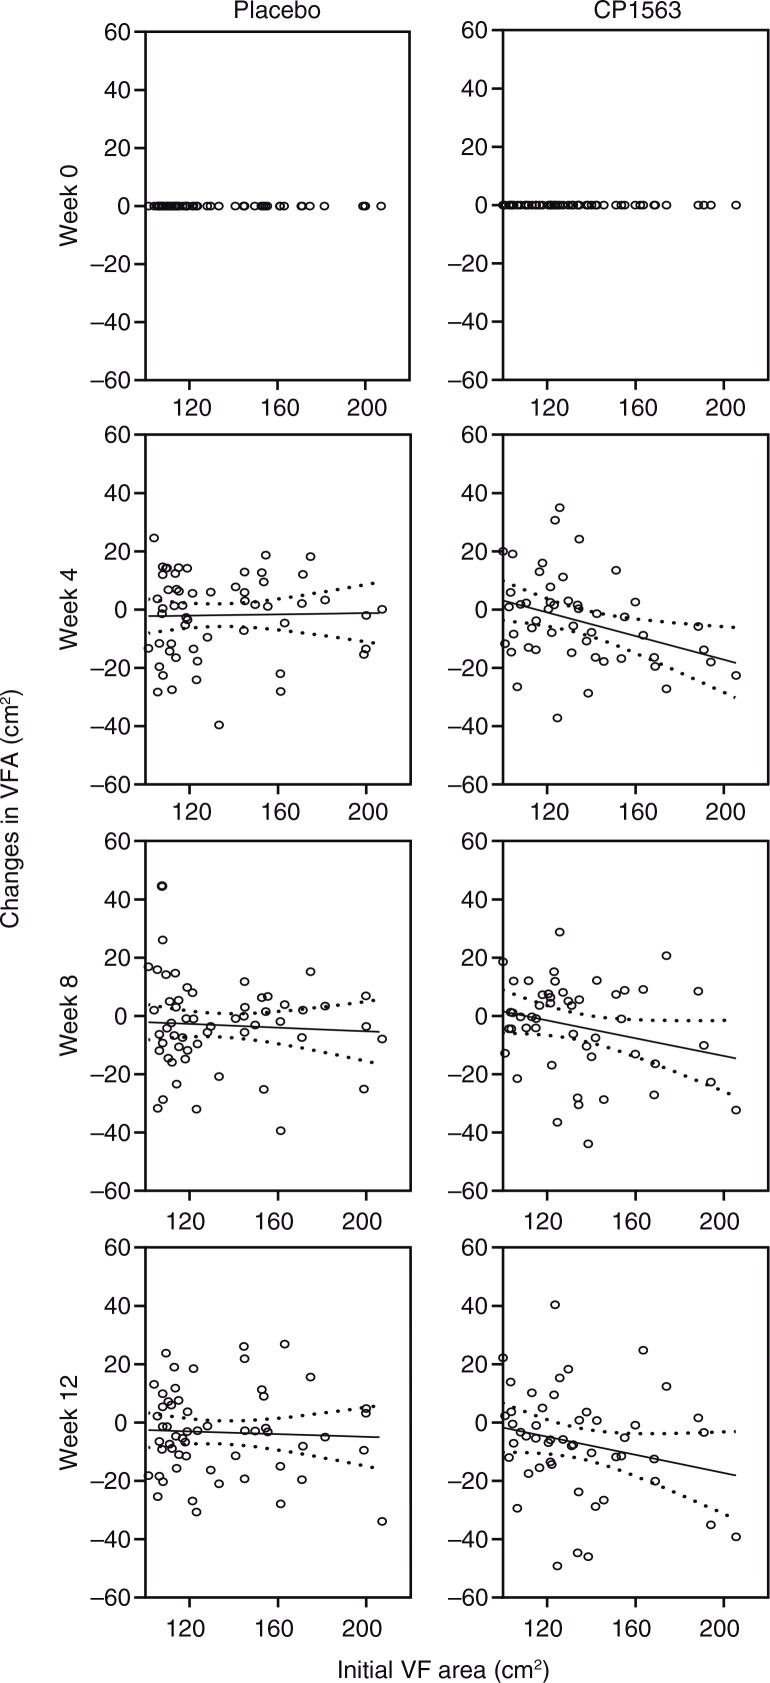
Fig. 3.
Time-dependent changes in visceral fat area (cm2) in subjects with higher values (≥100 cm2) at baseline. Visceral fat areas were measured at weeks 4, 8, 12 and 16 in subjects with higher initial values at baseline. The solid line is the regression line, and the dotted line shows the 95% confidence intervals of the population mean values. Statistical significance was determined according to the interaction of the factor group×time using ANCOVA for repeated measures.

