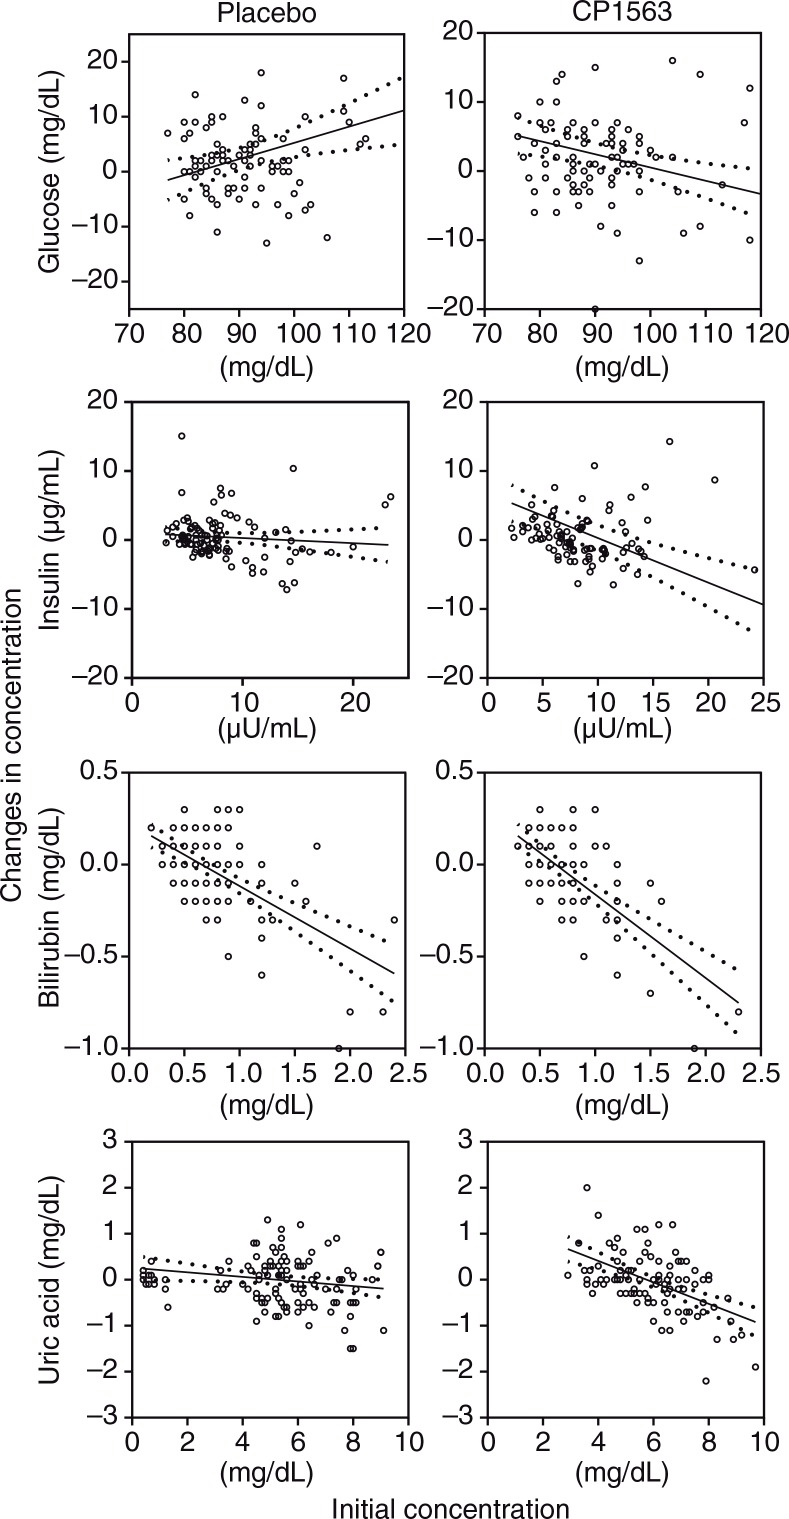
Fig. 6.
Changes in the concentrations of chemical substance in the blood after 12 weeks of ingestion: glucose, insulin, bilirubin and uric acid. The solid line is the regression line, and the dotted line shows the 95% confidence intervals of the population mean values. Statistical significance was determined according to the interaction of the factor group×time using ANCOVA for repeated measures.

