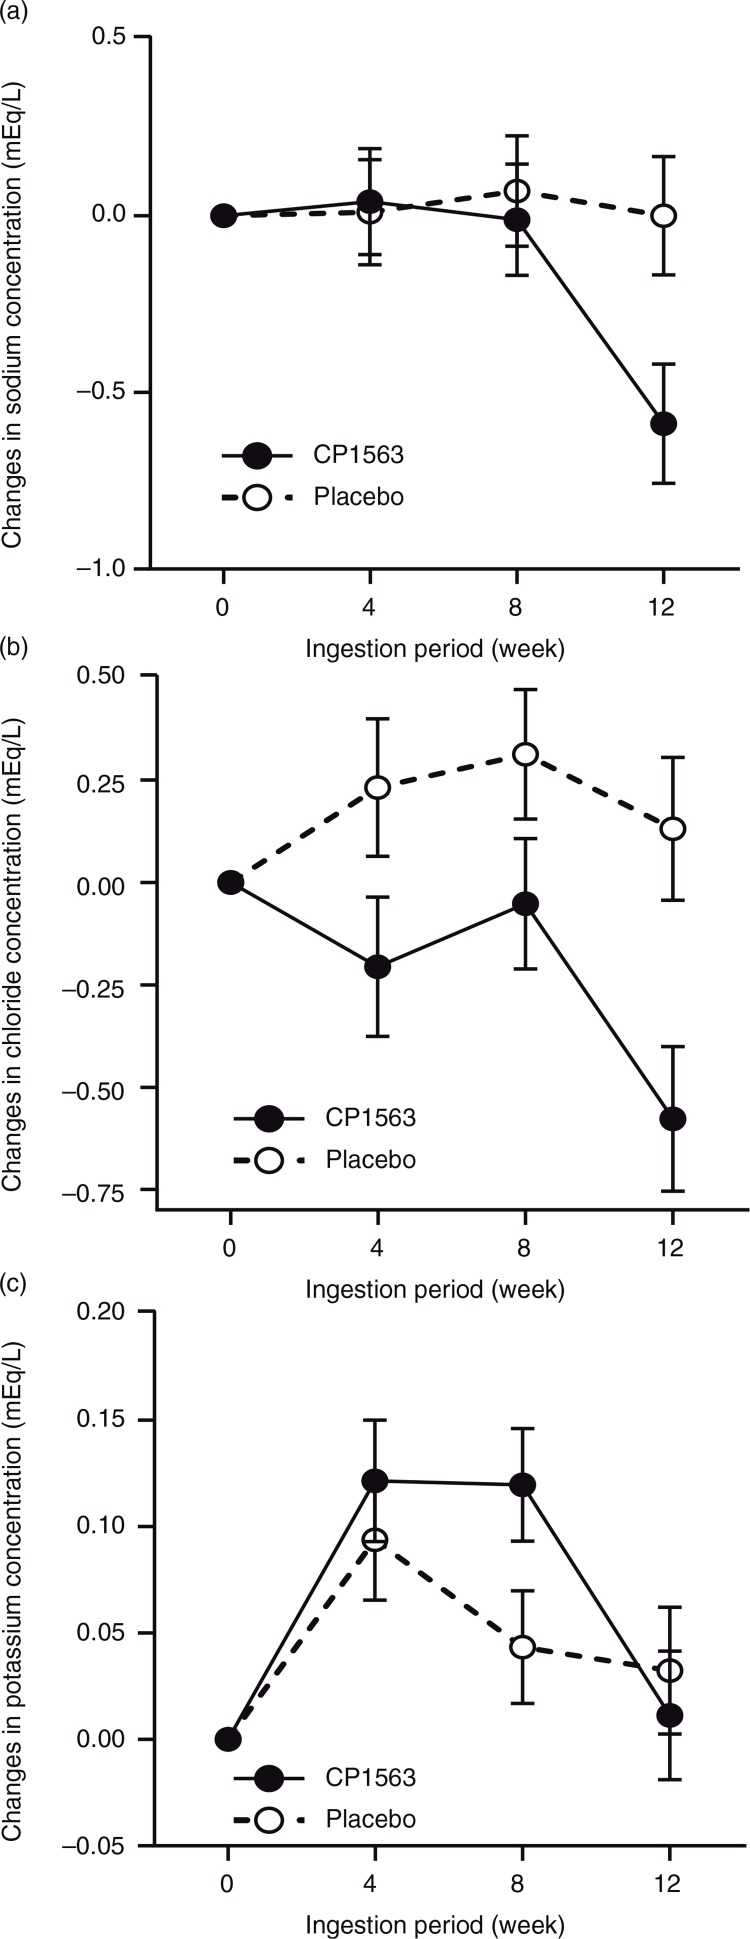
Fig. 7.
Changes in the plasma concentrations of chemical elements throughout the ingestion period: (a) sodium, (b) chloride and (c) potassium. Closed circles indicate the test group, and open circles indicate the placebo group. Statistical significance was determined according to the interaction of the factor group×time using ANCOVA for repeated measures.

