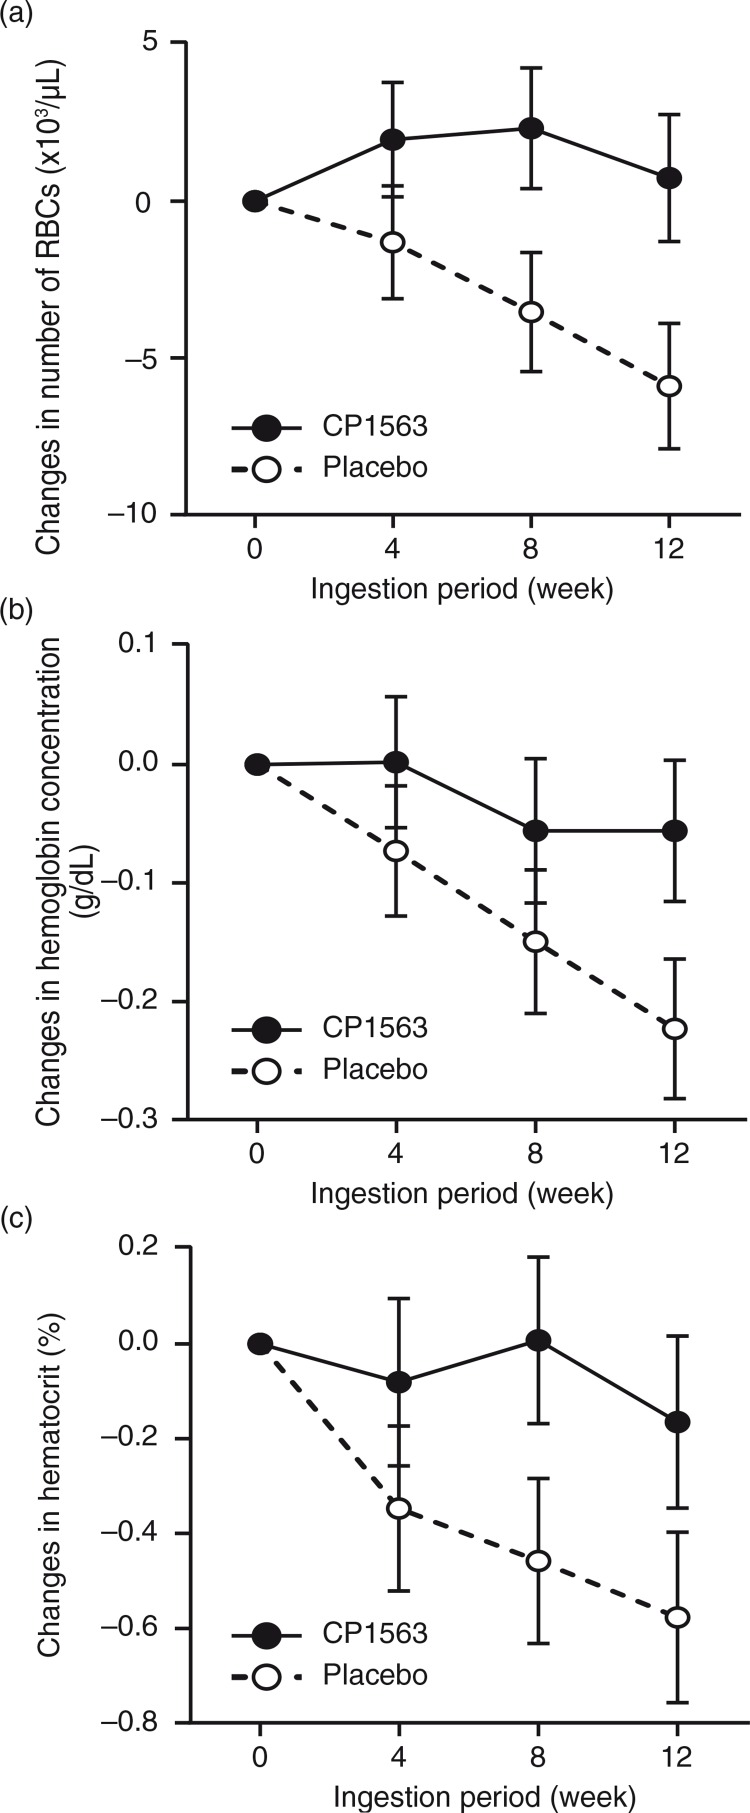
Fig. 8.
Changes in red blood cell counts throughout the ingestion period: (a) erythrocyte, (b) hemoglobin concentration and (c) hematocrit concentration. Closed circles indicate the test group, and open circles indicate the placebo group. Statistical significance was determined according to the interaction of the factor group×time using ANCOVA for repeated measures.

