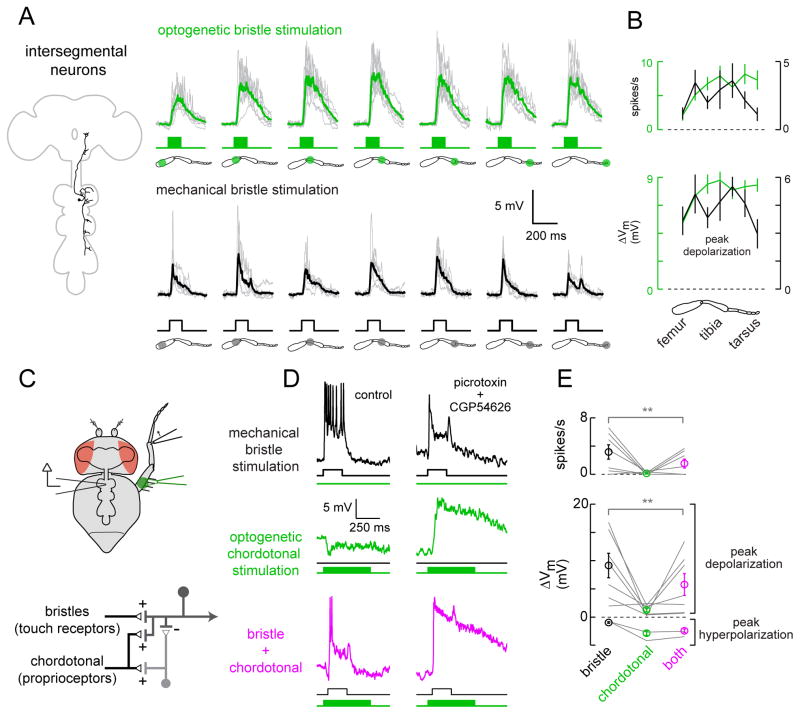
Figure 4. Intersegmental neurons compare touch and proprioceptive inputs.
(A) Top: membrane potential responses of intersegmental neurons to optogenetic stimulation of bristle neurons (individual cells in gray, average in green, n = 9). Bottom: responses of a subset of the same neurons to mechanical stimulation of small numbers of bristles (individual cells in gray, average in black, n = 6).
(B) Average spike rates and peak voltage changes for the cells shown in (A), mean ± SEM across cells, plotted versus stimulus location. Optogenetic responses are in green, mechanical responses in black.
(C) Top: bristle neurons on the distal tibia are stimulated mechanically, and the femoral chordotonal organ is stimulated optogenetically. Bottom: proposed circuit diagram for sensory inputs converging onto intersegmental neurons, with proprioceptive inhibition routed via an interposed inhibitory interneuron. Chordotonal neurons also drive excitation (directly or indirectly), but this is normally masked by inhibition.
(D) Inhibitory input driven by chordotonal neurons suppresses excitatory input from leg bristle neurons. The top and middle rows show responses of a typical intersegmental neuron to stimulation of bristle neurons or chordotonal neurons alone. In the bottom row, the two stimuli are delivered together. The optogenetic stimulus precedes the mechanical stimulus, and is more prolonged, in order to increase the effect of inhibition. Antagonists of synaptic inhibition (100 μM picrotoxin and 50 μM CGP54626) block the suppressive effect of chordotonal neuron stimulation, revealing underlying excitation; similar effects were seen in a total of 6 experiments (data not shown). The postsynaptic neuron is not spiking in the presence of antagonists because the neuron has been depolarized to the point where it cannot initiate spikes.
(E) Average spike rates and peak voltage changes, ± SEM across cells, for all experiments like that shown in the left column of (D). Inhibition driven by chordotonal neurons significantly suppressed responses to bristle neuron stimulation (n = 9 cells, **, P = 0.03 for depolarization and P=0.03 for spikes, Wilcoxon signed rank test).

