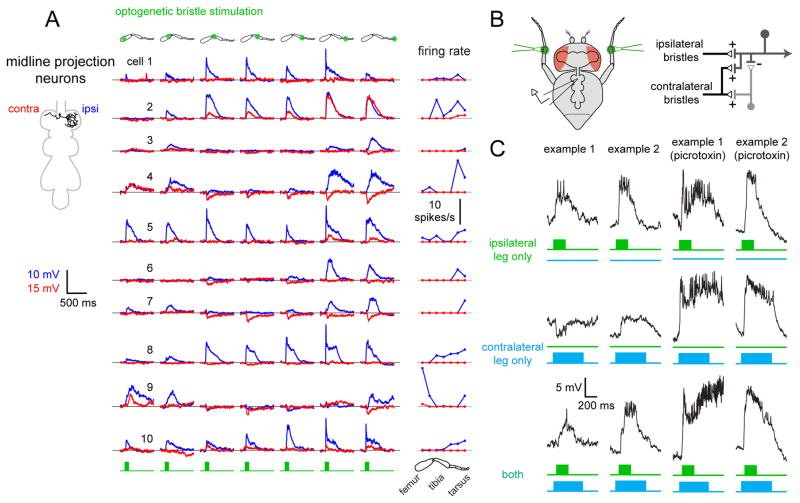
Figure 6. Midline projection neurons compare touch stimuli across the body midline.
(A) Trial-averaged responses of 10 midline projection neurons to optogenetic stimulation of bristle neurons. For each neuron, responses were measured for both the ipsilateral (blue) and contralateral (red) prothoracic legs. Ipsilateral is defined as the side containing the reconstructed neuron’s primary arborization (schematic at left). The right column shows trial-averaged spike rates versus stimulus location.
(B) Left: schematic of the recording configuration. Bristles on the contralateral and ipsilateral tibia are stimulated optogenetically. Right: proposed circuit diagram for those midline projection neurons that combine ipsilateral excitation with contralateral inhibition.
(C) Integration of touch signals across legs. Top and middle: responses of local neurons to independent stimulation of ipsilateral and contralateral bristles. Bottom: the two stimuli are delivered together. Picrotoxin (10 μM) blocks inhibition from contralateral bristles, revealing excitation (Figure S7B). Data for all experiments of this type are shown in Figure S7.

