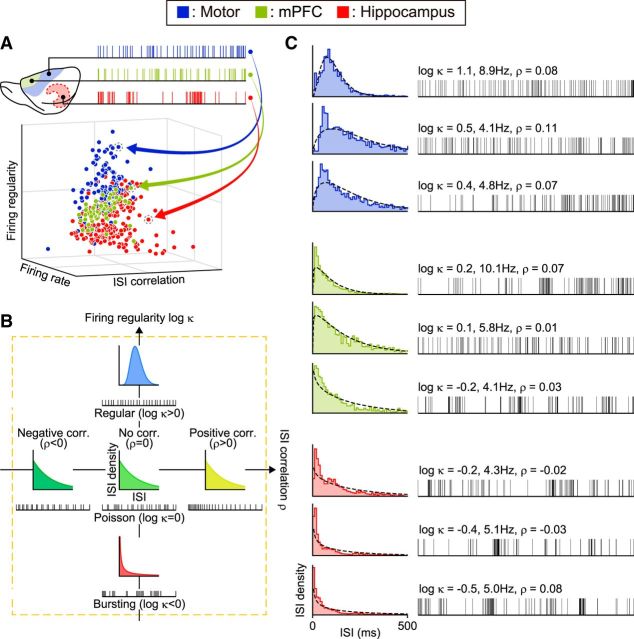
Figure 1.
Characterizing neuronal spike trains. A, Mapping spike trains into pseudo-3D plots. Neuronal spike trains recorded from various functional areas are plotted with axes of firing rate, regularity, and ISI correlation. B, Firing regularity versus ISI correlation. Firing regularity is defined as the logarithm of the shape factor κ of the gamma distribution fitted to the ISIs. A spike train is considered Poisson random if its ISIs are exponentially distributed (κ = 1 or log κ = 0), whereas it is considered regular if log κ > 0 or bursting if log κ < 0. The Spearman's rank-order correlation computed for sequentially paired ISIs indicates whether consecutive ISIs are positively correlated (ρ > 0) or negatively correlated (ρ < 0). C, Spike trains sampled from rat motor cortex, medial prefrontal cortex, and hippocampus with their corresponding ISI histograms. The dotted lines in ISI histograms show the best fit gamma distributions with the estimated values of κ and λ. Raster plots show the first 101 spikes, or 100 ISIs.

