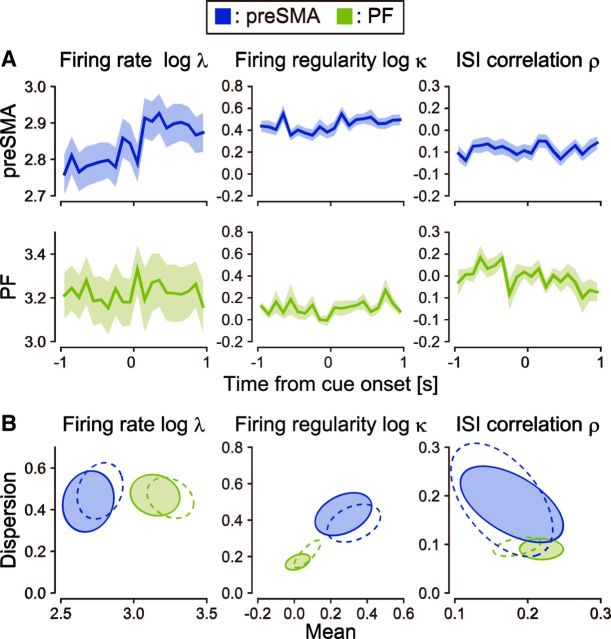
Figure 7.
Temporal variation of firing characteristics. A, Population histograms of firing rates, firing regularity, and ISI correlation of neurons in preSMA and PF of monkeys aligned at cue onset. The shaded regions represent SEs. B, Distributions of the firing characteristics estimated before (solid ellipses representing 75% confidence regions) and after (dashed ellipses) cue onset for neuronal populations.

