Figure 2.
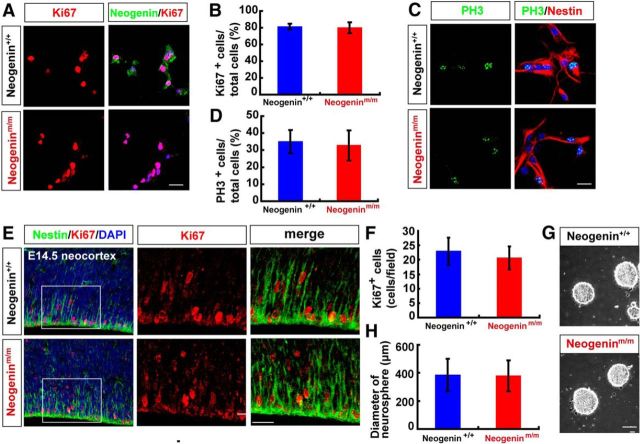
Normal self-renewal of neogenin-deficient neocortical NSCs in culture and in vivo. A, C, Double immunostaining analysis of Ki67 (red) and neogenin (green) (A), PH3 (green), and Nestin (red) (C) in WT and neogeninm/m NSCs. B, D, Quantitative analysis of the percentages of Ki67 (B) (n = 12 per group) or PH3 (D) (n = 12 per group) positive cells over total NSCs. E, Coimmunostaining analysis of Ki67 (red) and nestin (green) in E14.5 neocortex of WT and neogeninm/m embryos (sagittal sections). F, Quantitative analysis of Ki67-positive cell density in WT and neogeninm/m mice (n = 12 per group). G, Representative images of the cultured WT and neogeninm/m neurospheres. H, Quantification of neurosphere size at primary cultures from E14.5 WT and neogeninm/m mice (n = 100 per group). DAPI (blue) was used to stain nuclei. Scale bars, 20 μm. Data are mean ± SD.

