
Figure 3.
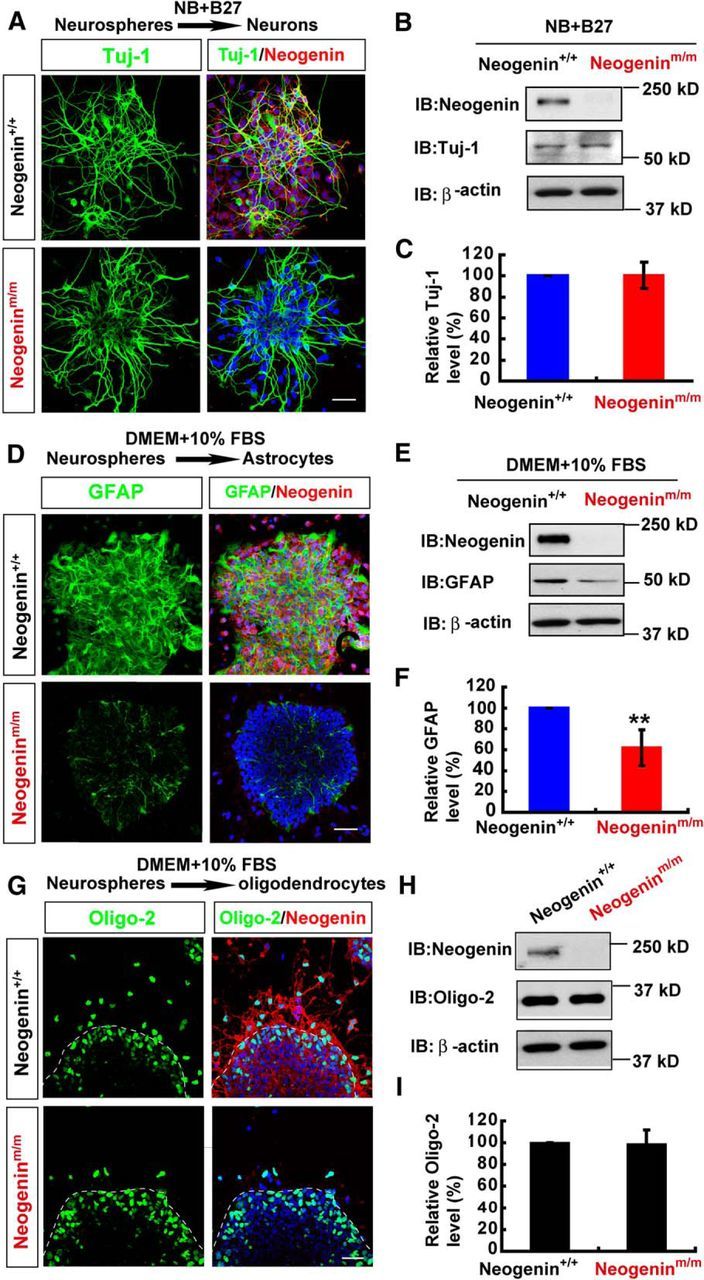
Impaired astrocytic differentiation, but normal neuronal and oligodendrocytic differentiation, from neogenin-deficient neocortical NSCs. A, Double immunostaining analysis of Tuj-1 (green) and neogenin (red) in neurons differentiated from neurospheres (by incubating with neurobasal plus 2% B27 media for 2 d). B, Western blot analysis of Tuj-1 in neurons differentiated from WT and neogeninm/m neurospheres as shown in A. C, Quantitative analysis of Western blot data in B (n = 3 per group, normalized to WT group). D, Double immunostaining analysis of GFAP (green) and neogenin (red) in astrocytes differentiated from WT and neogeninm/m neurospheres (by incubating with DMEM plus 10% FBS media). E, Western blot analysis of GFAP expression in lysates of astrocytes differentiated from WT and neogeninm/m neurospheres. F, Quantitative analysis of Western blot data in E (n = 3 per group, normalized to WT group). G, Double immunostaining analysis of Oligo-2 (green) and neogenin (red) in oligodendrocytes differentiated from WT and neogeninm/m neurospheres (by incubating with DMEM plus 10% FBS media). H, Western blot analysis of Oligo-2 expression in oligodendrocytes differentiated from WT and neogeninm/m neurospheres. I, Quantitative analysis of Western blot data in H (n = 3 per group, normalized to WT group). Scale bars, 20 μm. Data are mean ± SEM. **p < 0.01, compared with control group (Student's t test).